A tour of a very
small flight crew.
From the rocket to the retinal pixels. Explore every main workspace, follow a command through the circuit, and inspect what the simulator actually measures.
Captured 14 September 2026 · Original browser images · Click any image for full resolution
Mission control
Back to top ↑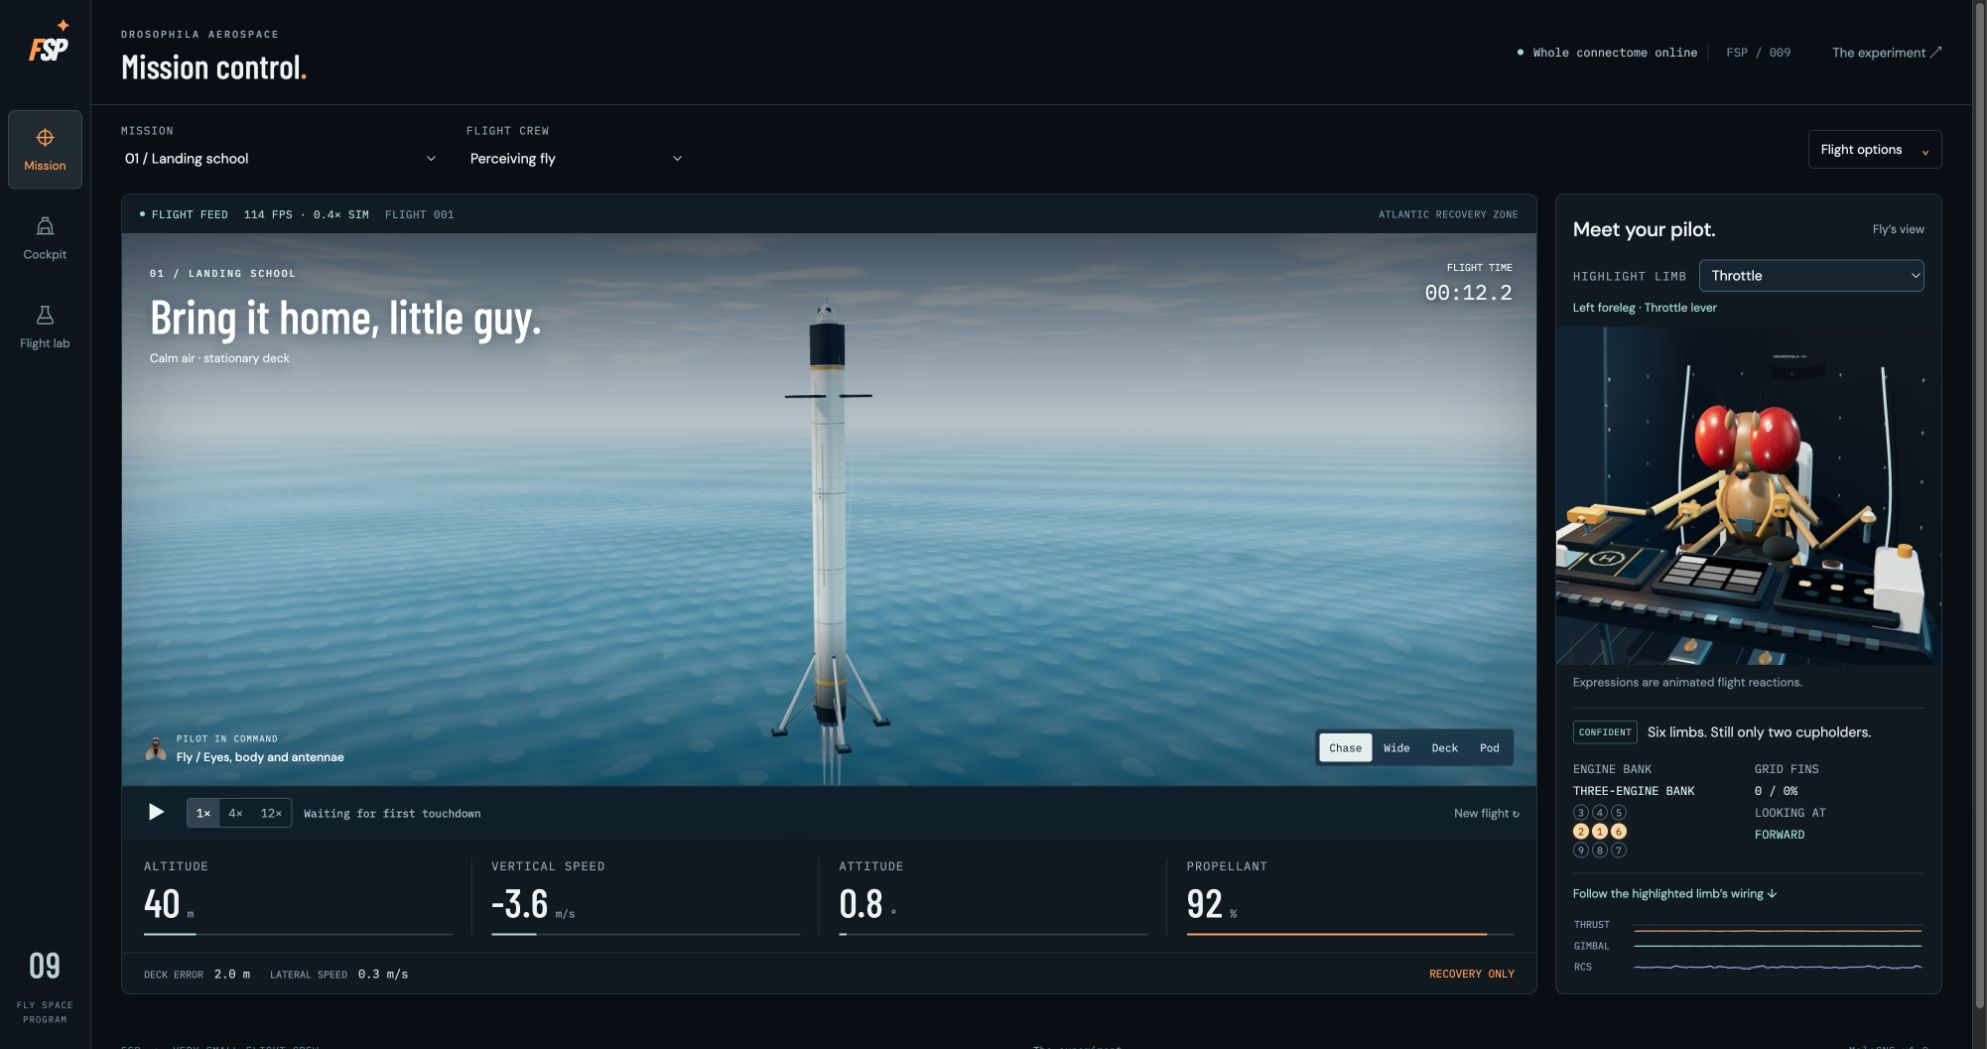
01Mission control
The released Perceiving fly on Landing school, with flight telemetry, the Chase camera, animated crew and actuator traces. Session counts are local observations, not the formal benchmark.
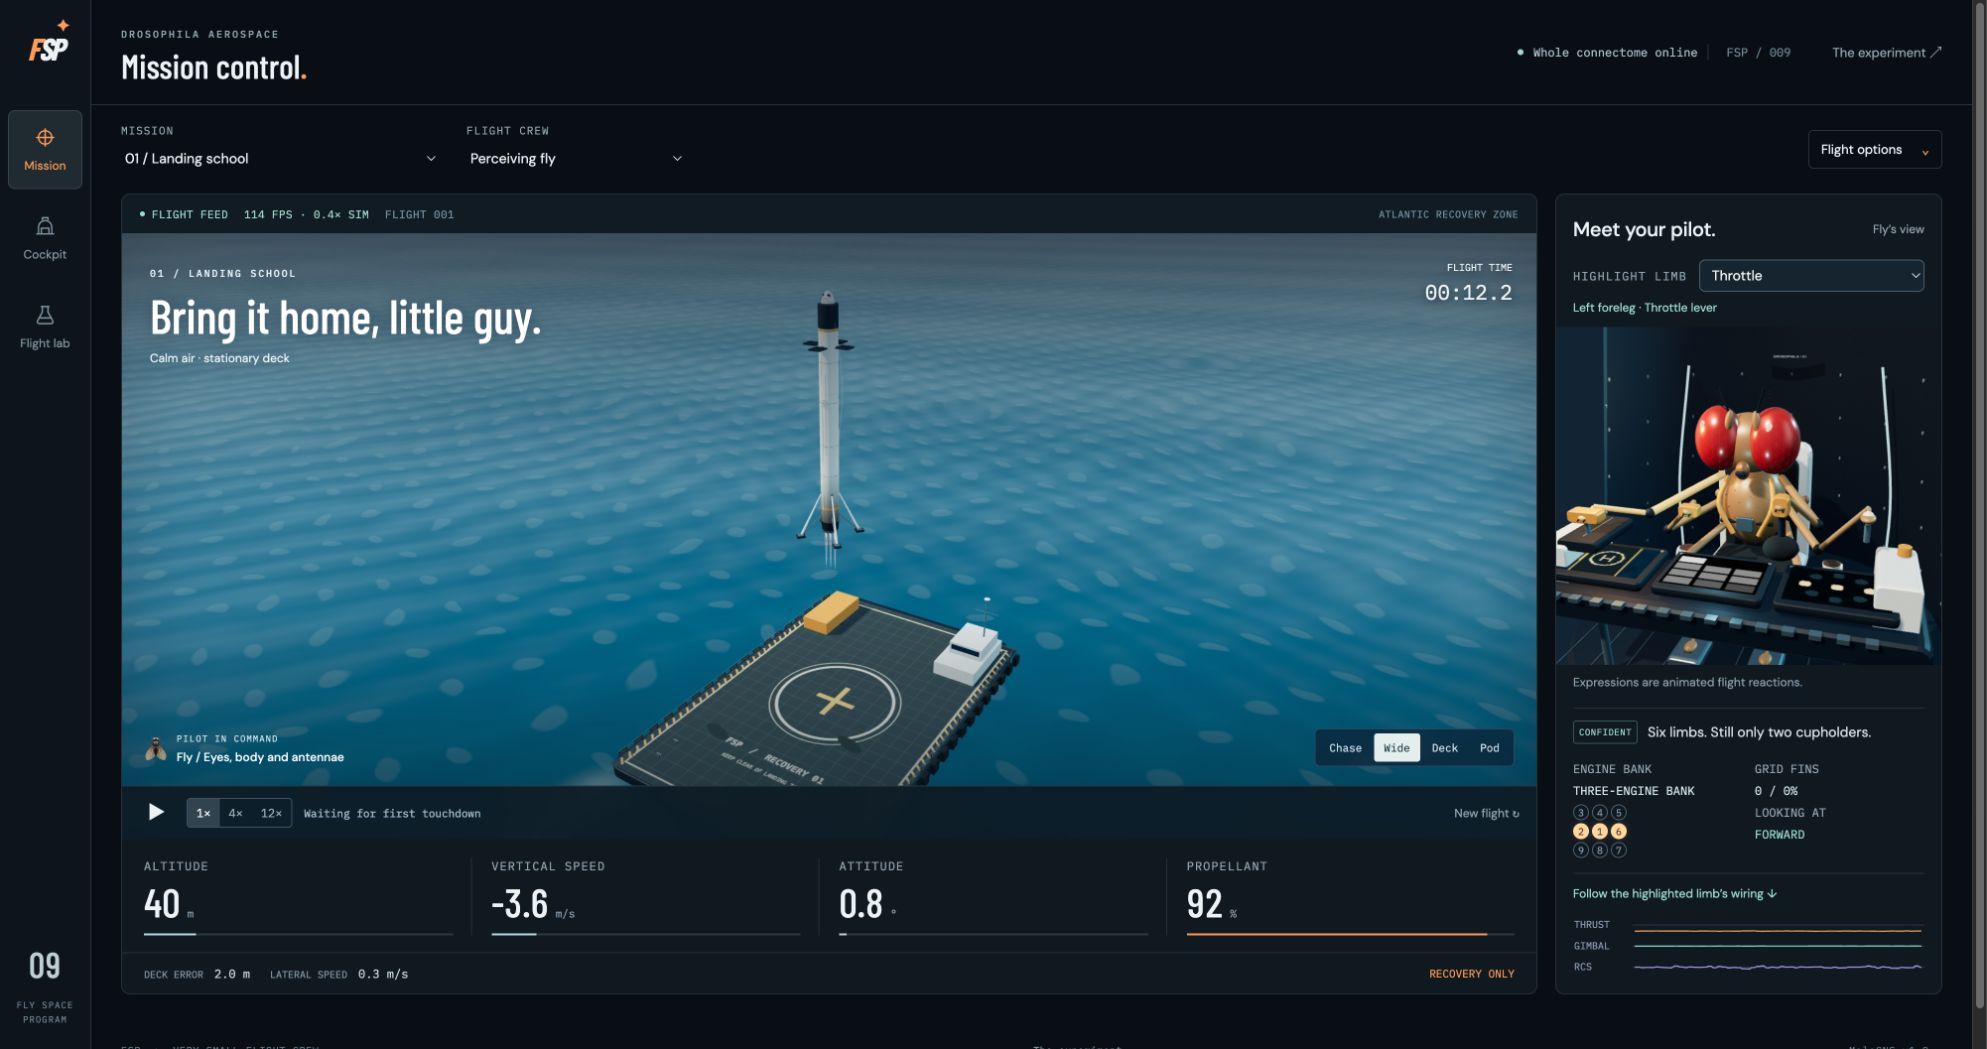
02Wide flight camera
The same paused flight in Wide view shows the booster and ocean landing platform together.
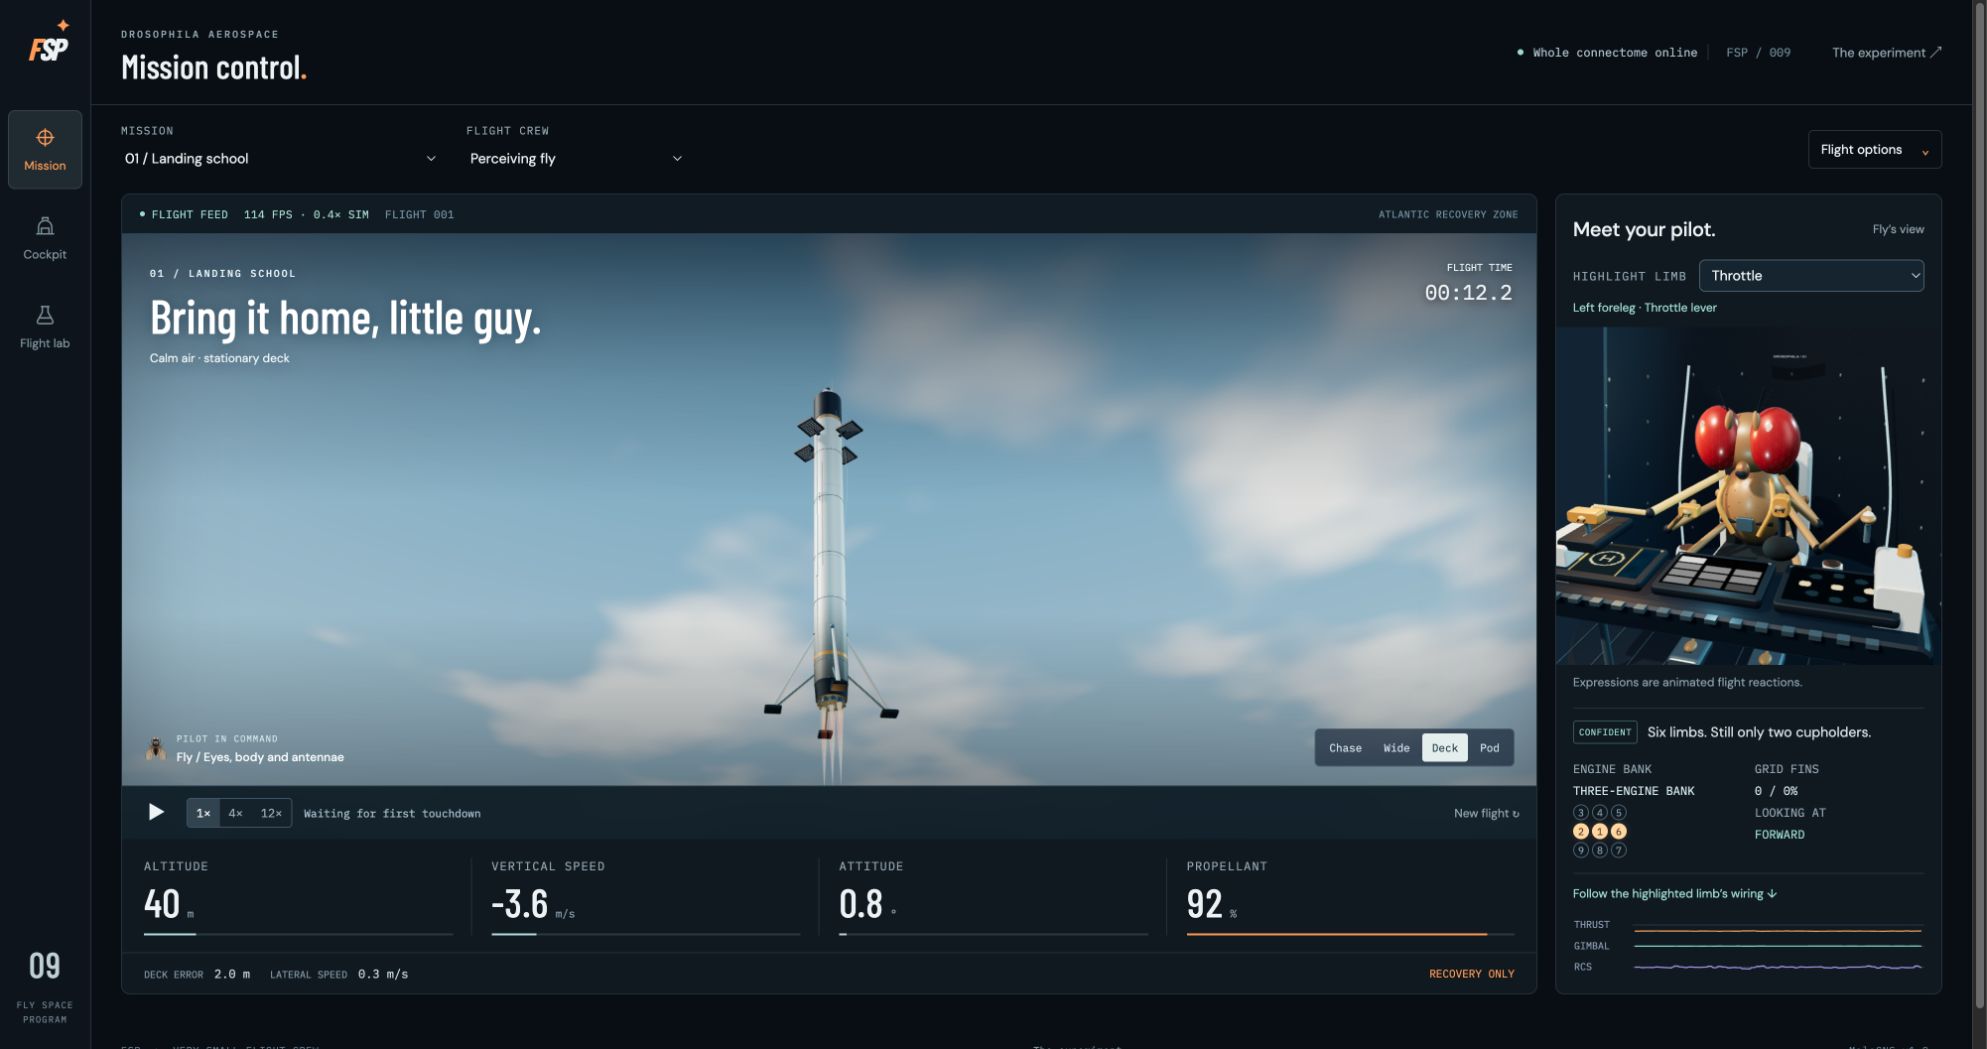
03Deck flight camera
The deck camera looks up toward the descending booster. It is an external spectator view.
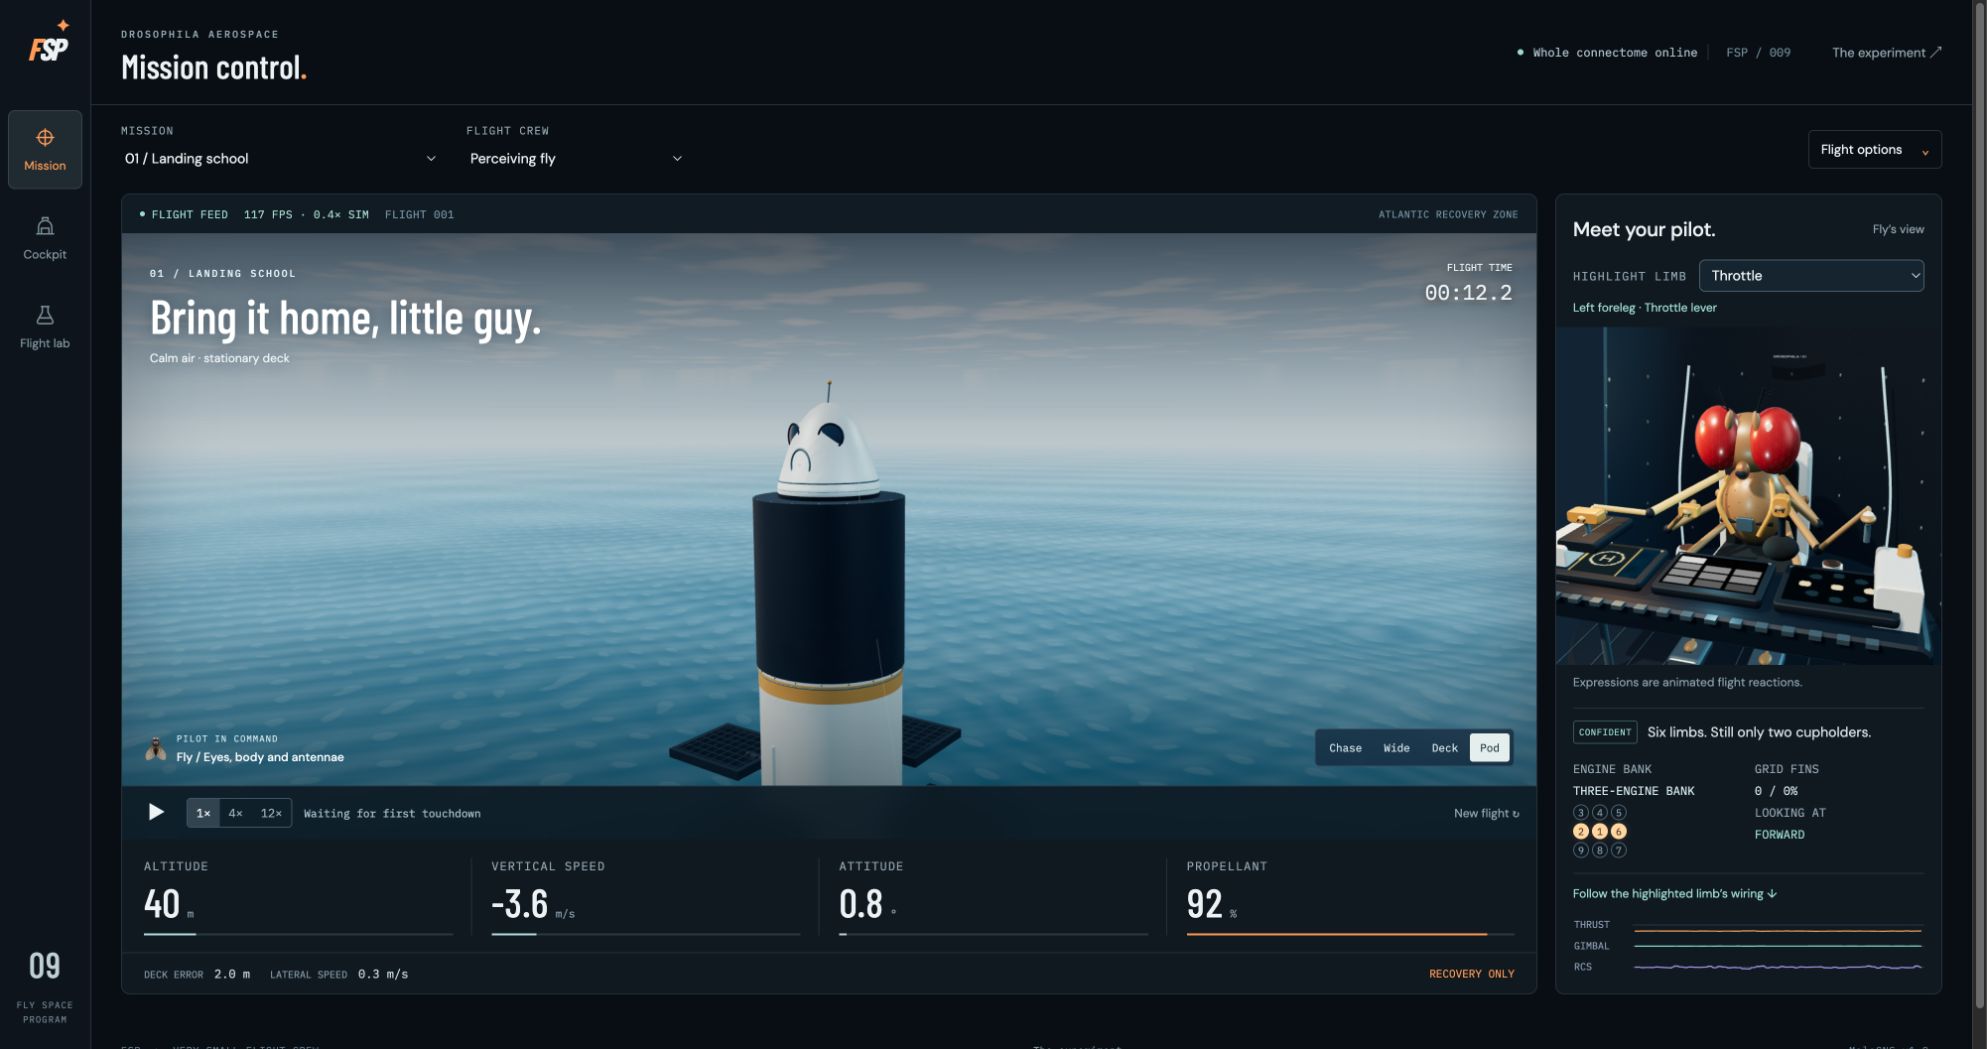
04Pod flight camera
An external camera near the crew compartment, with the cockpit illustration alongside it.
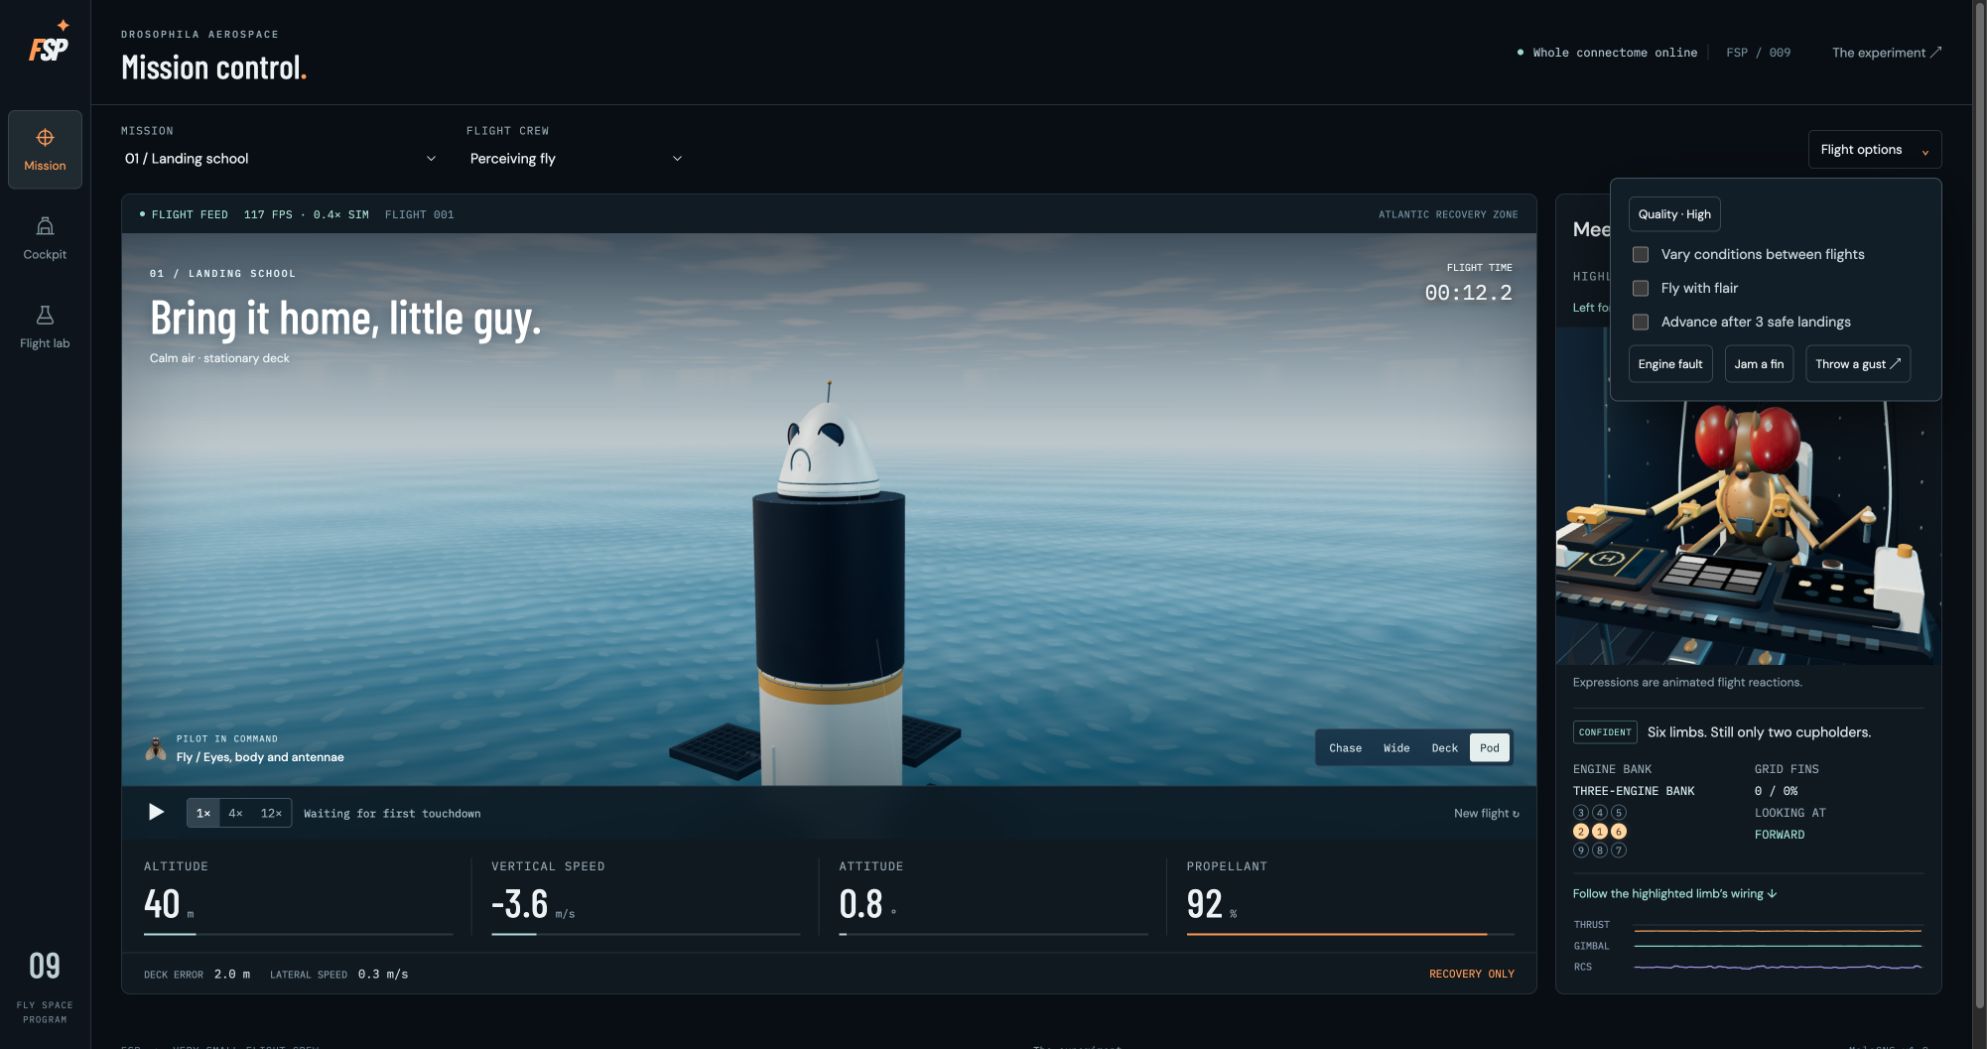
05Flight options
Quality, varied conditions, flair, progression, engine and fin faults, and gust controls. The controls are shown without injecting a fault or starting training.
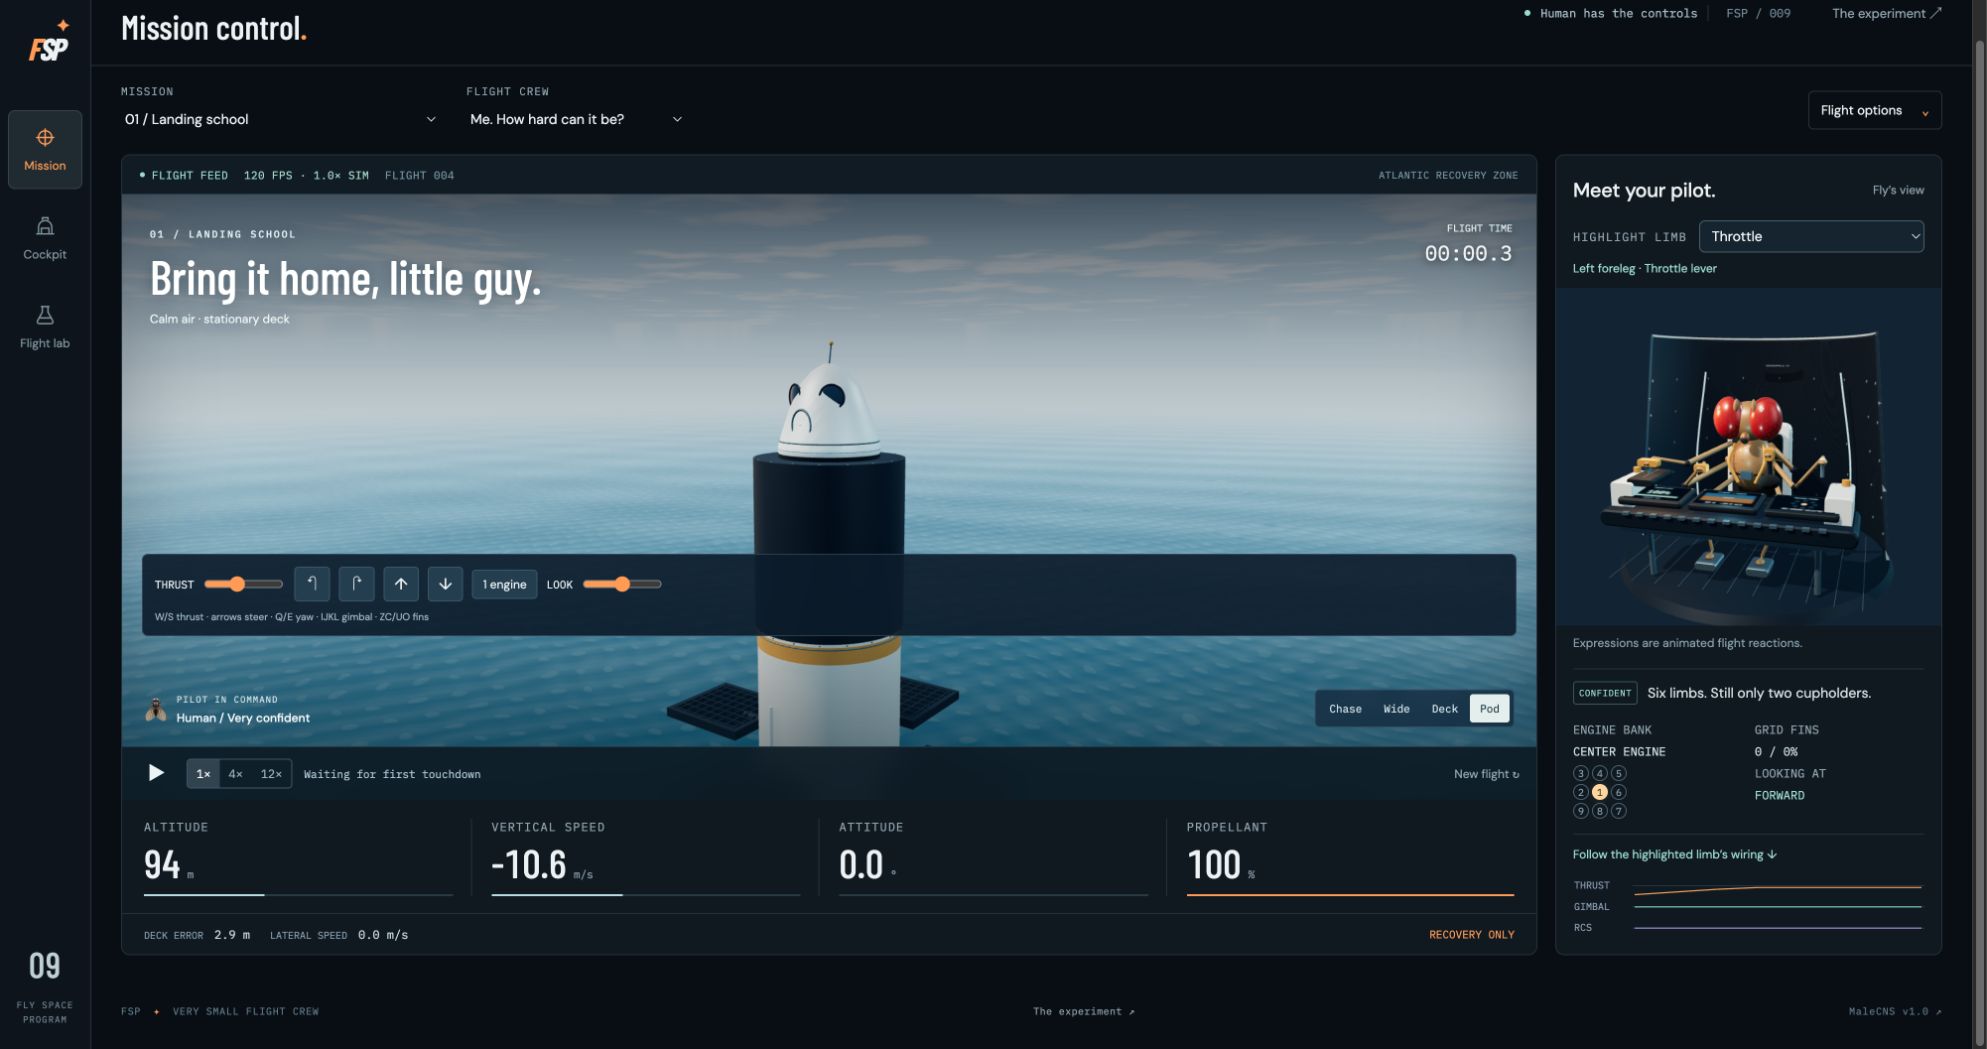
24Manual flight controls
Human control mode exposes thrust, rotation, translation, engine-bank and gaze controls, plus keyboard bindings. This frame is a manual flight, not a neural-controller result.
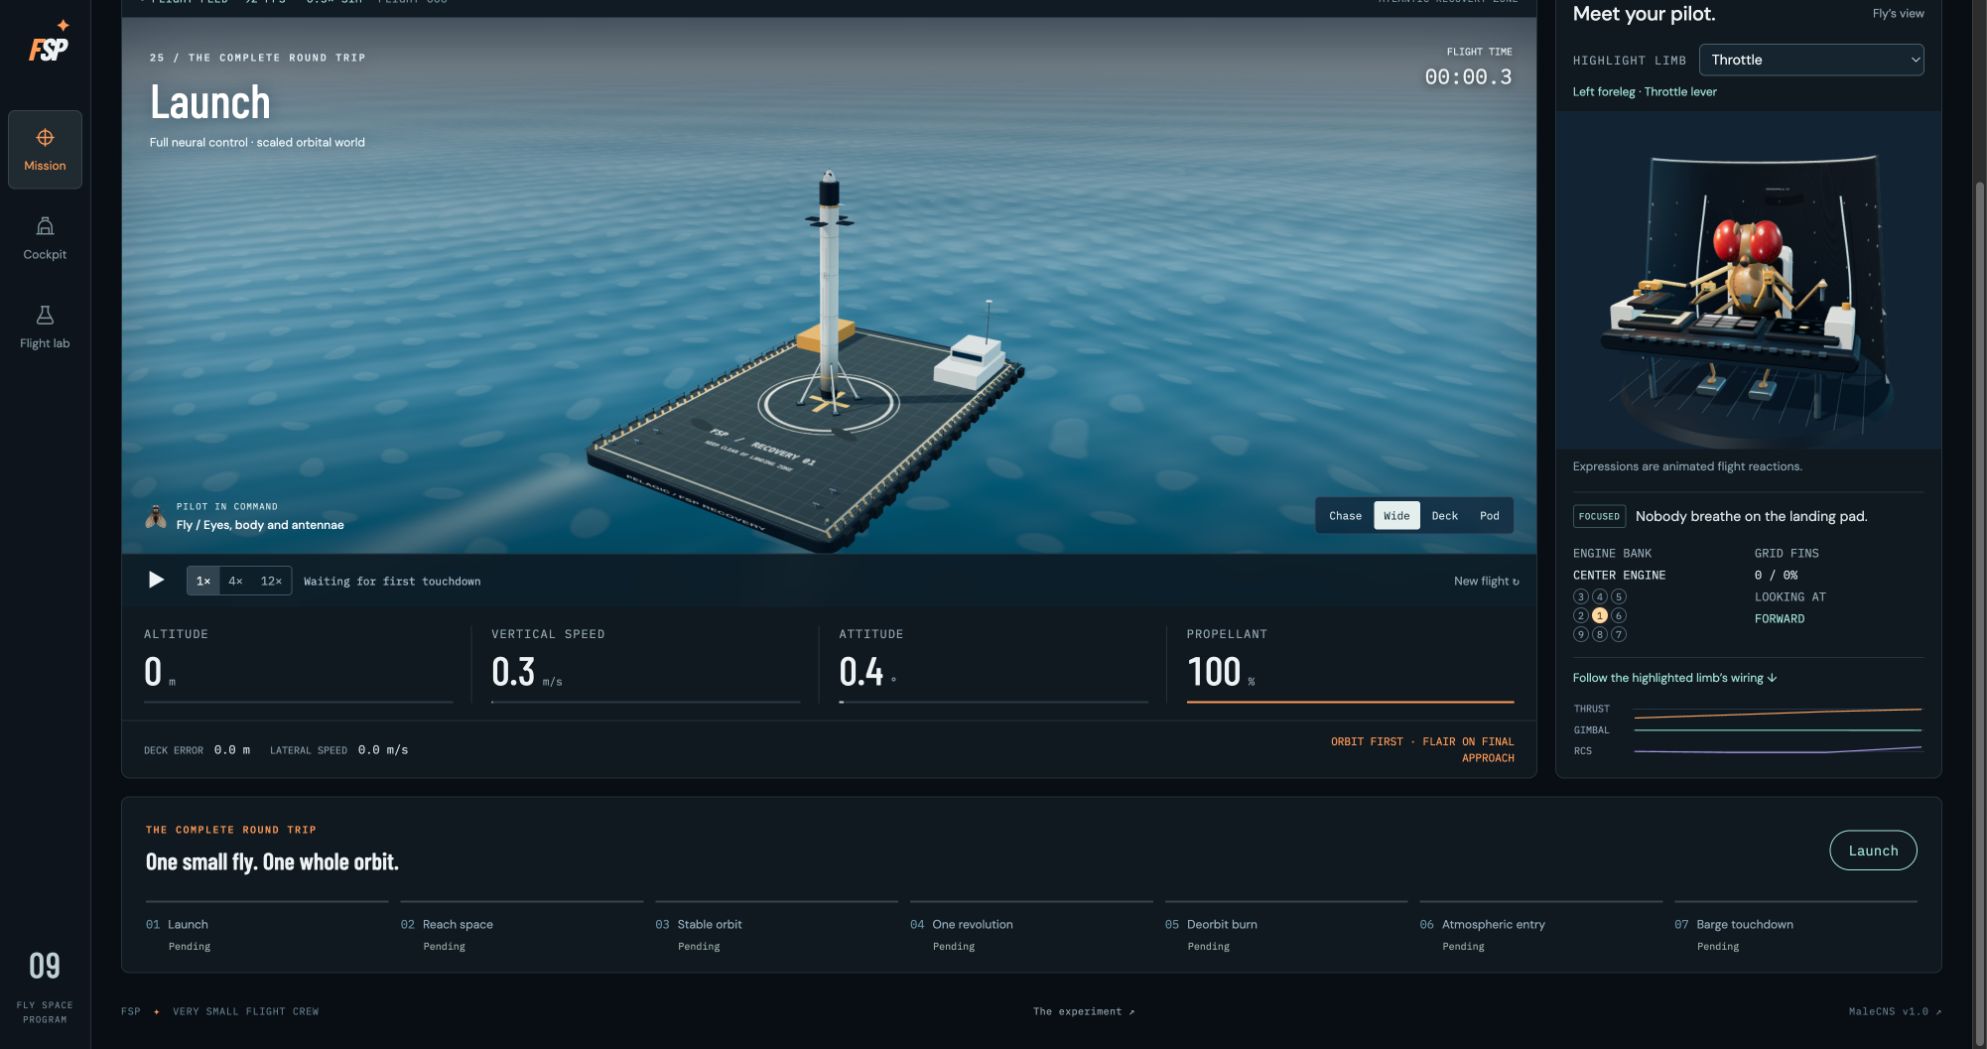
25Orbital flight interface
The launch phase of the complete-round-trip scenario with the perceiving fly selected. A launch frame does not demonstrate a completed orbit or recovery.
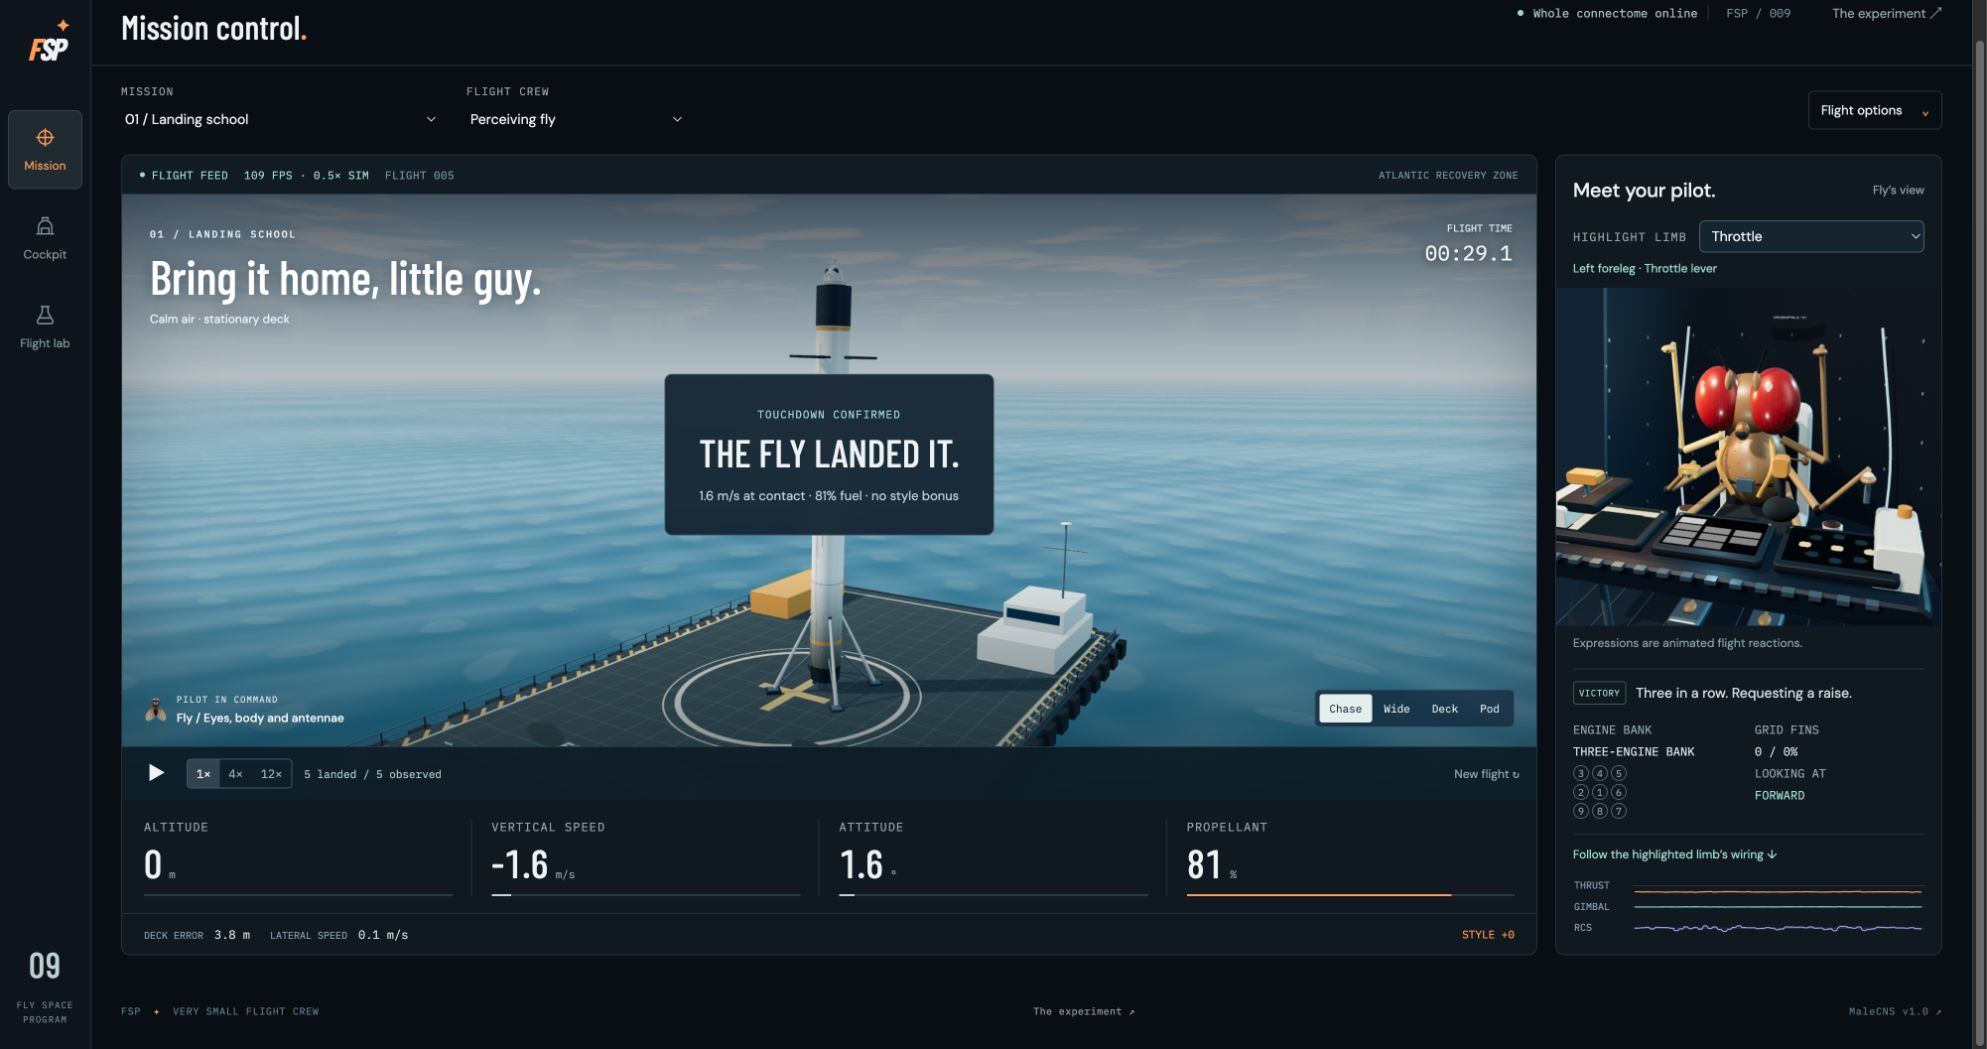
31A completed landing
A real paused Landing School touchdown from this browsing session: 1.6 m/s at contact and 81% fuel remaining. The local session count does not change the published 60/80 unseen-start evaluation.
Inside the crew pod
Back to top ↑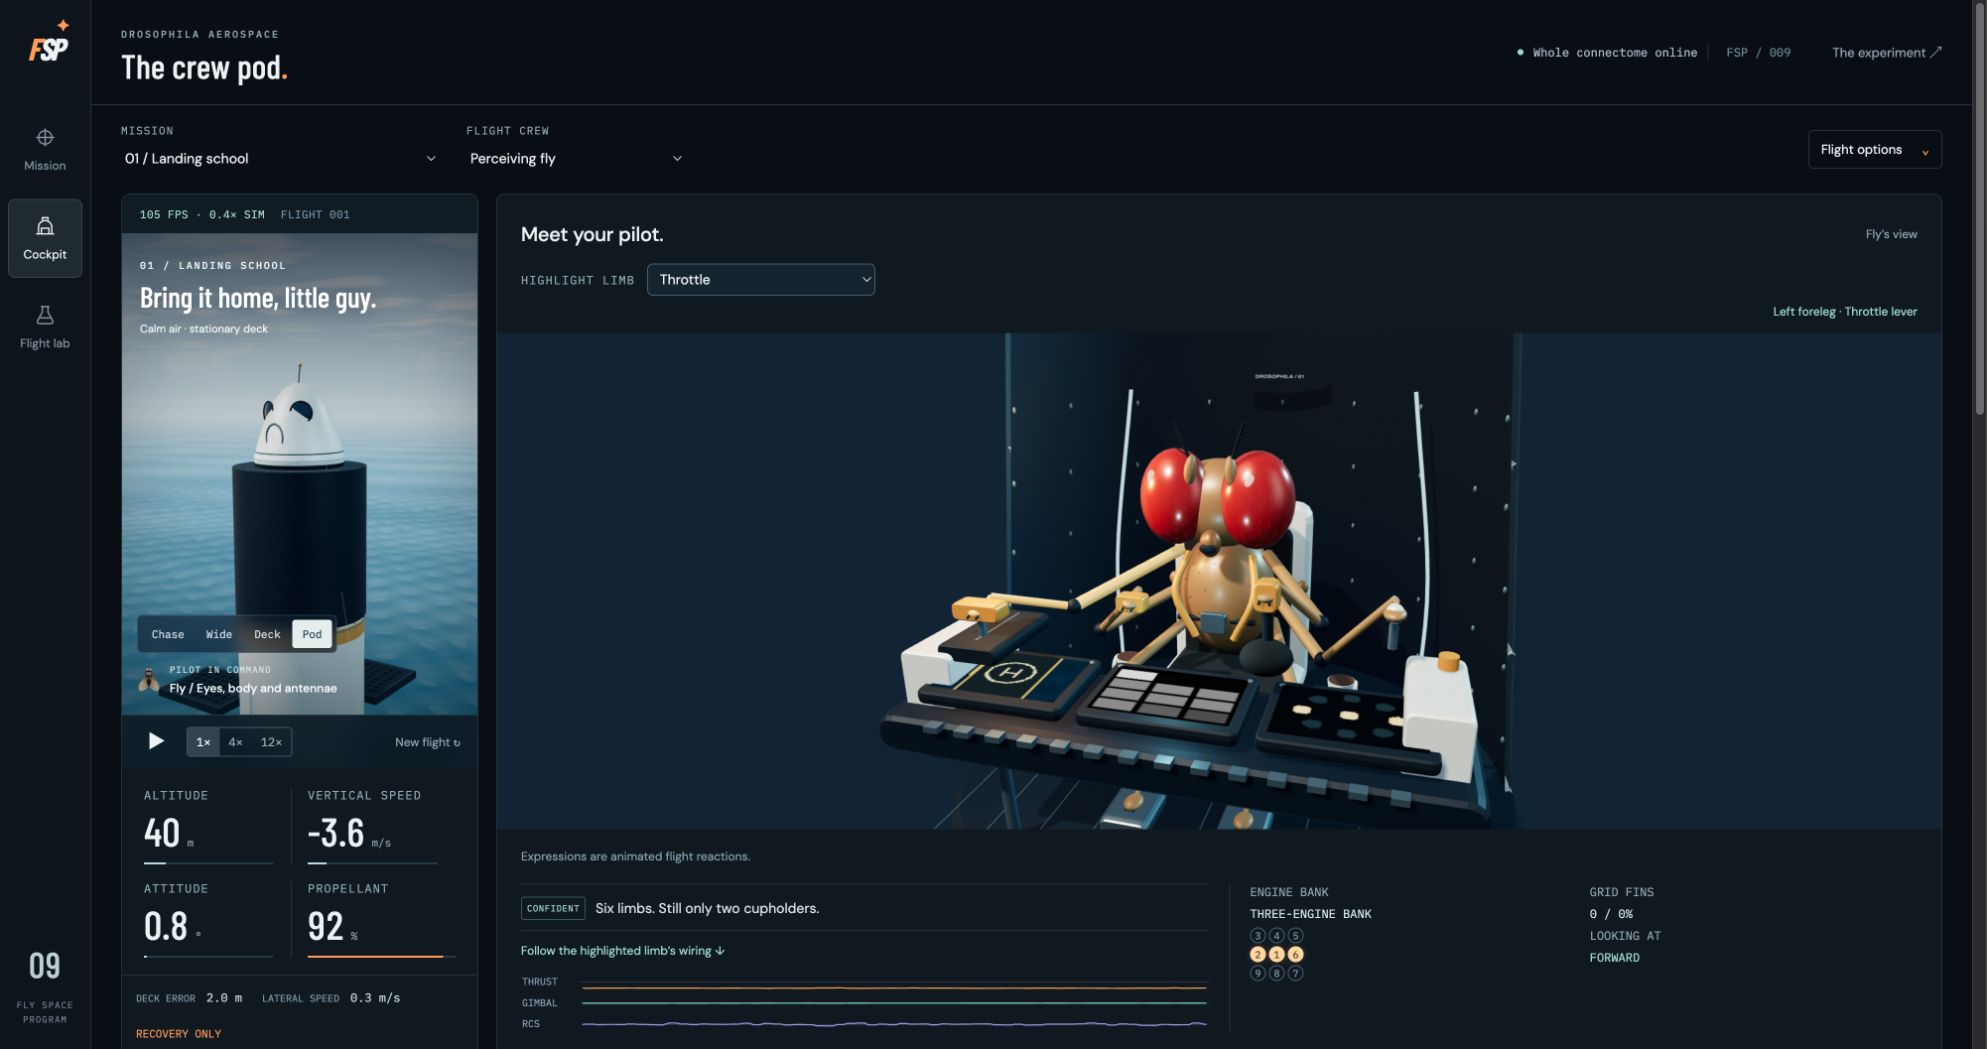
06Cockpit and selected limb
The enlarged crew pod with the throttle limb selected, engine-bank indicators and command traces. The fly is an animated illustration.
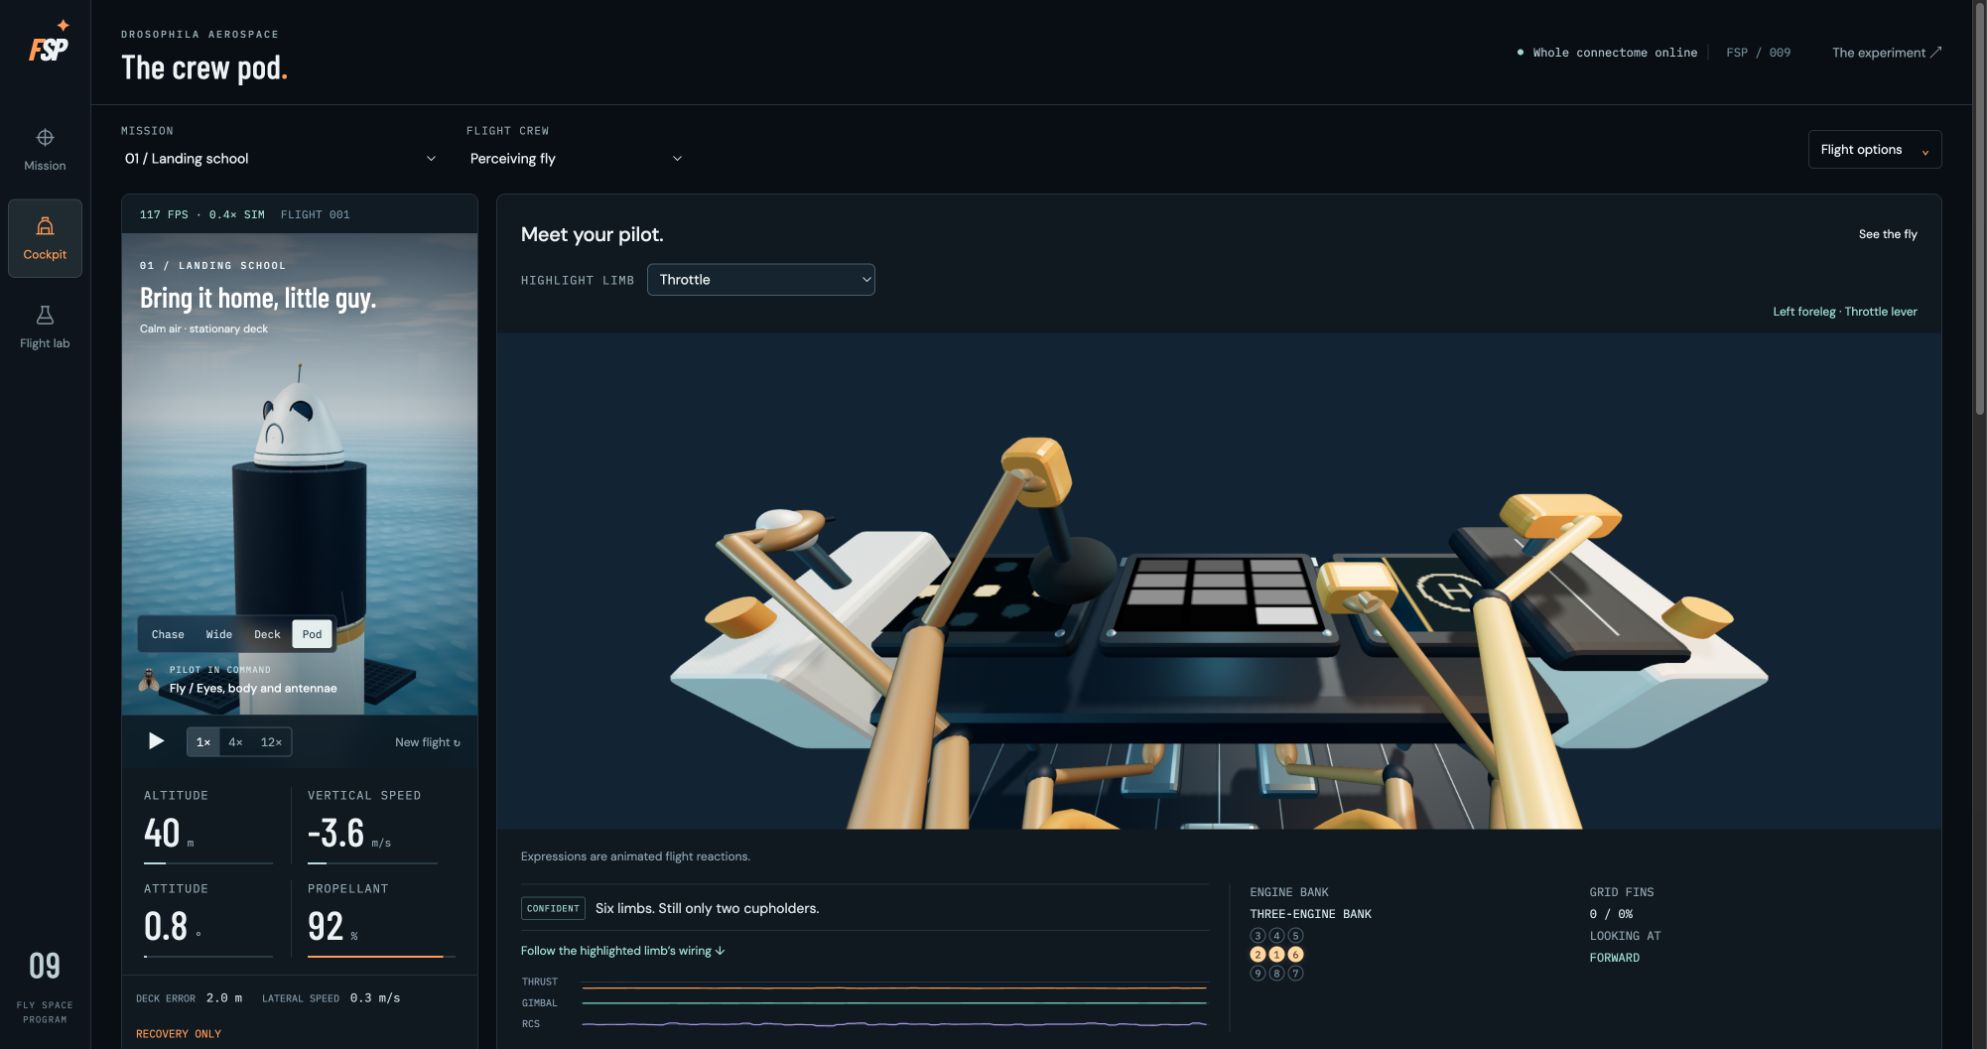
07Fly’s cockpit perspective
The illustrative view from inside the crew pod, facing the rendered monitors. Exact sampled eye inputs are documented separately.
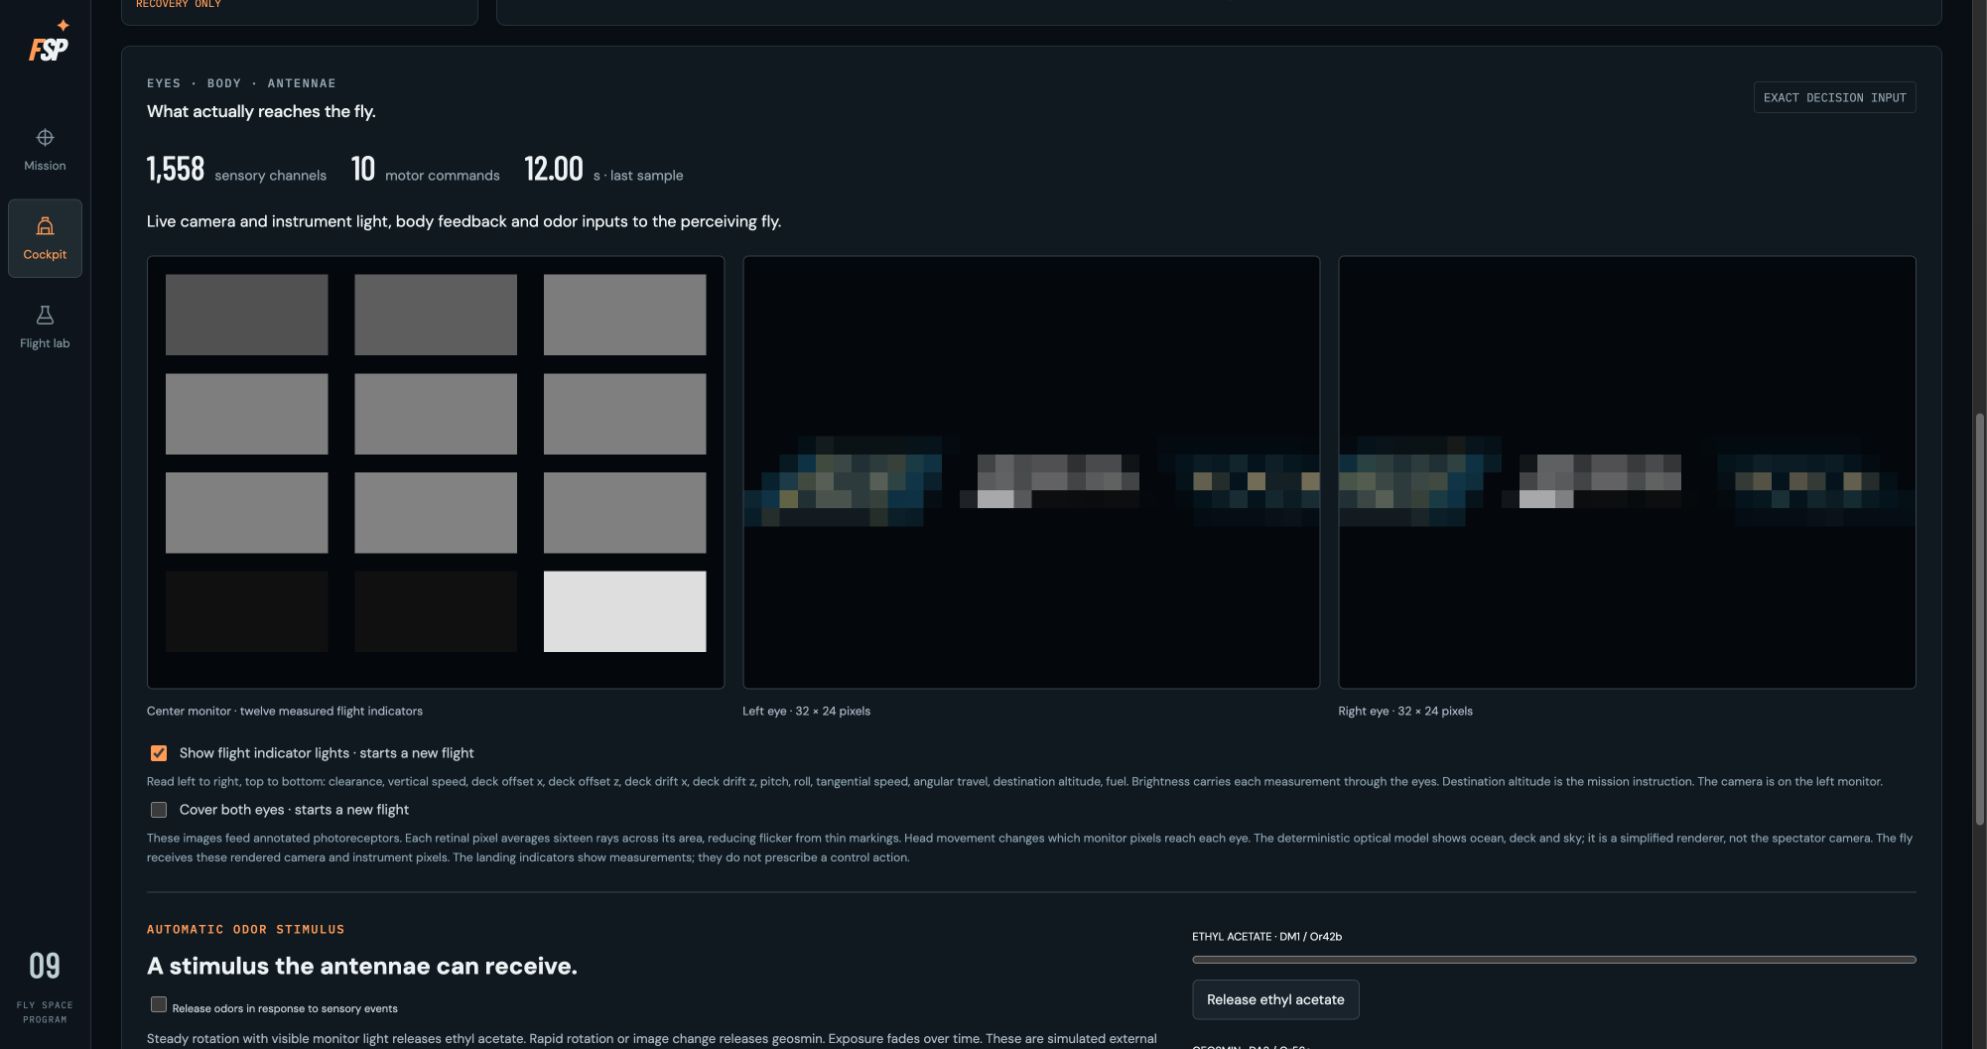
08Exact visual inputs
The actual monitor and 32 × 24 eye samples from the last controller decision. The checked indicator setting and sensory explanation describe how measurements reach the Perceiving fly through light.
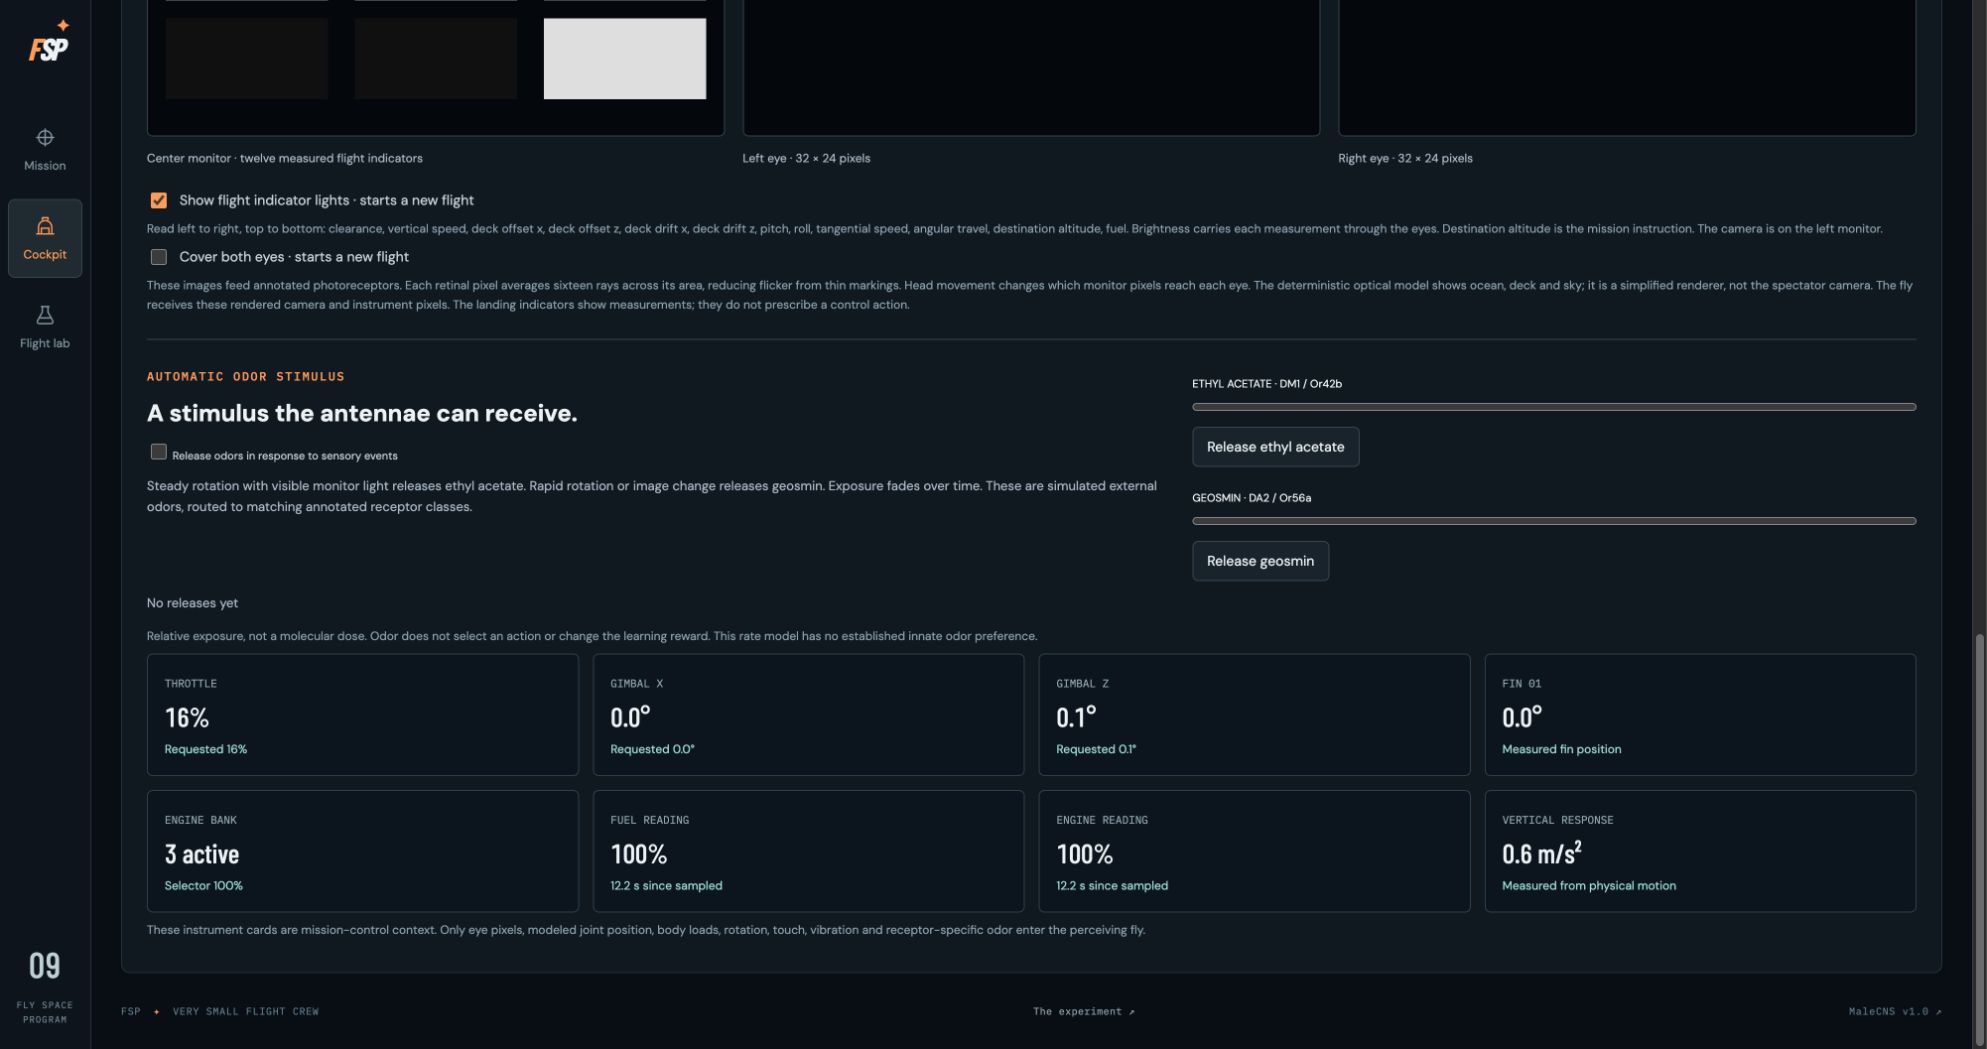
09Odor controls and body feedback
Receptor-specific odor controls, zero-exposure meters and the event log, followed by actuator and body-feedback cards. These cards are mission-control context, not extra hidden numerical inputs to the Perceiving fly.
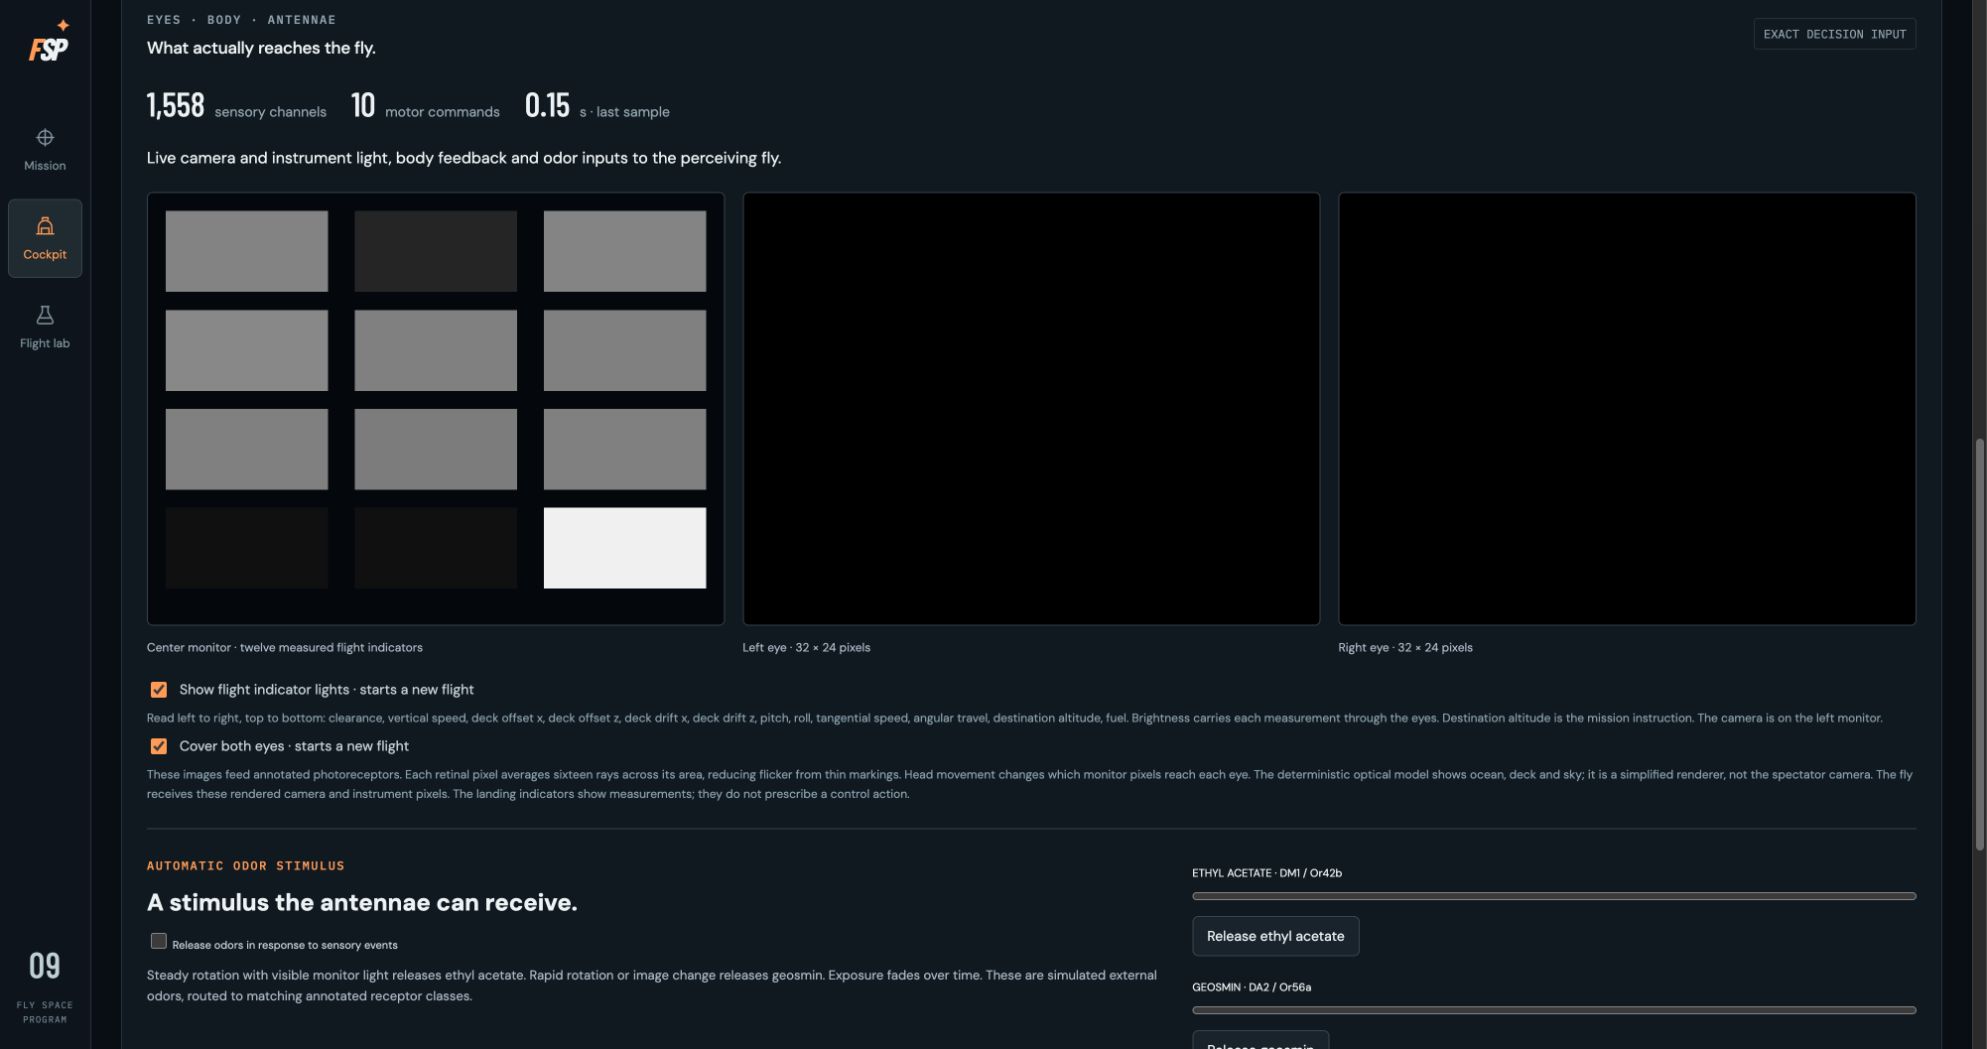
10Covered-eye control
Both eyes are covered in a fresh, sampled flight. The eye arrays are black while the external monitor remains visible; the checked control is shown alongside them.
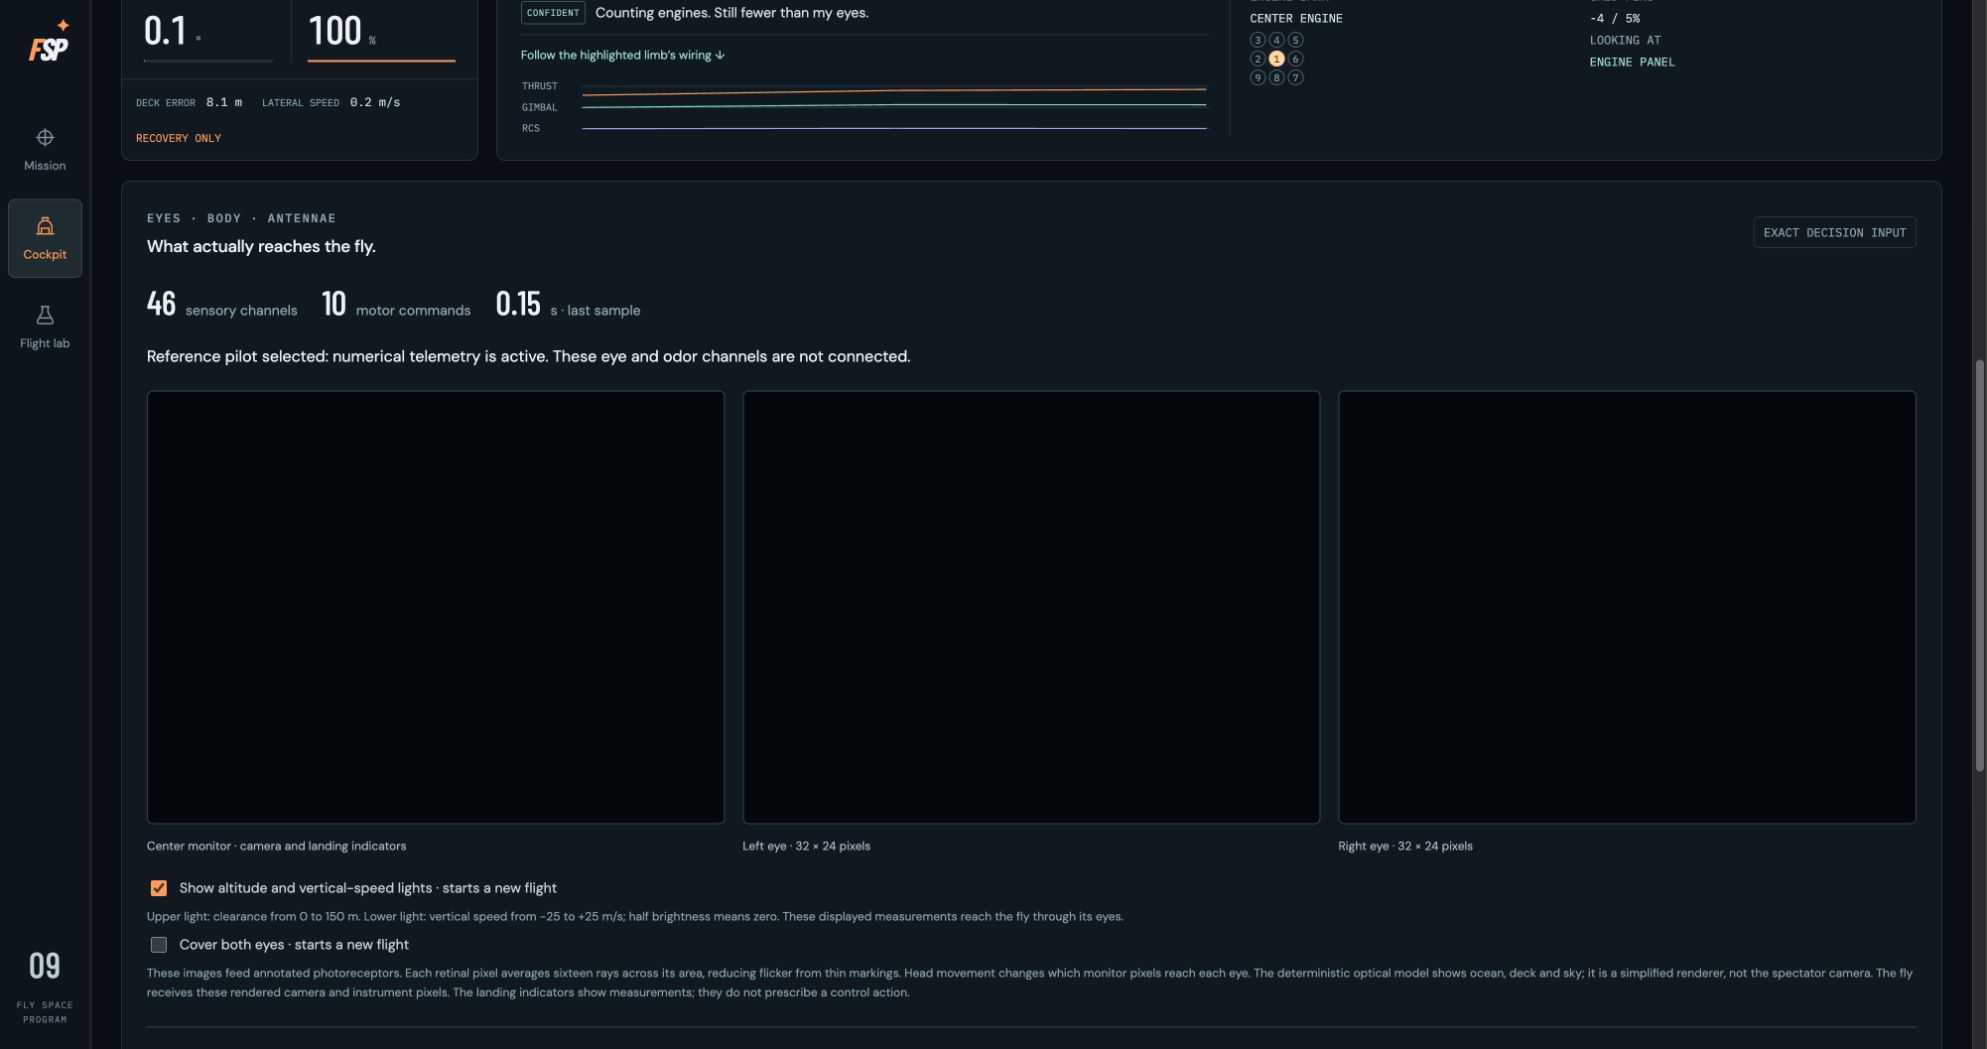
26Reference-pilot input boundary
Instrument-pilot mode explicitly receives 46 numerical channels. Its eye and odor displays are inactive; this interface distinguishes the reference controller from the perceiving fly.
Flight Lab and anatomy
Back to top ↑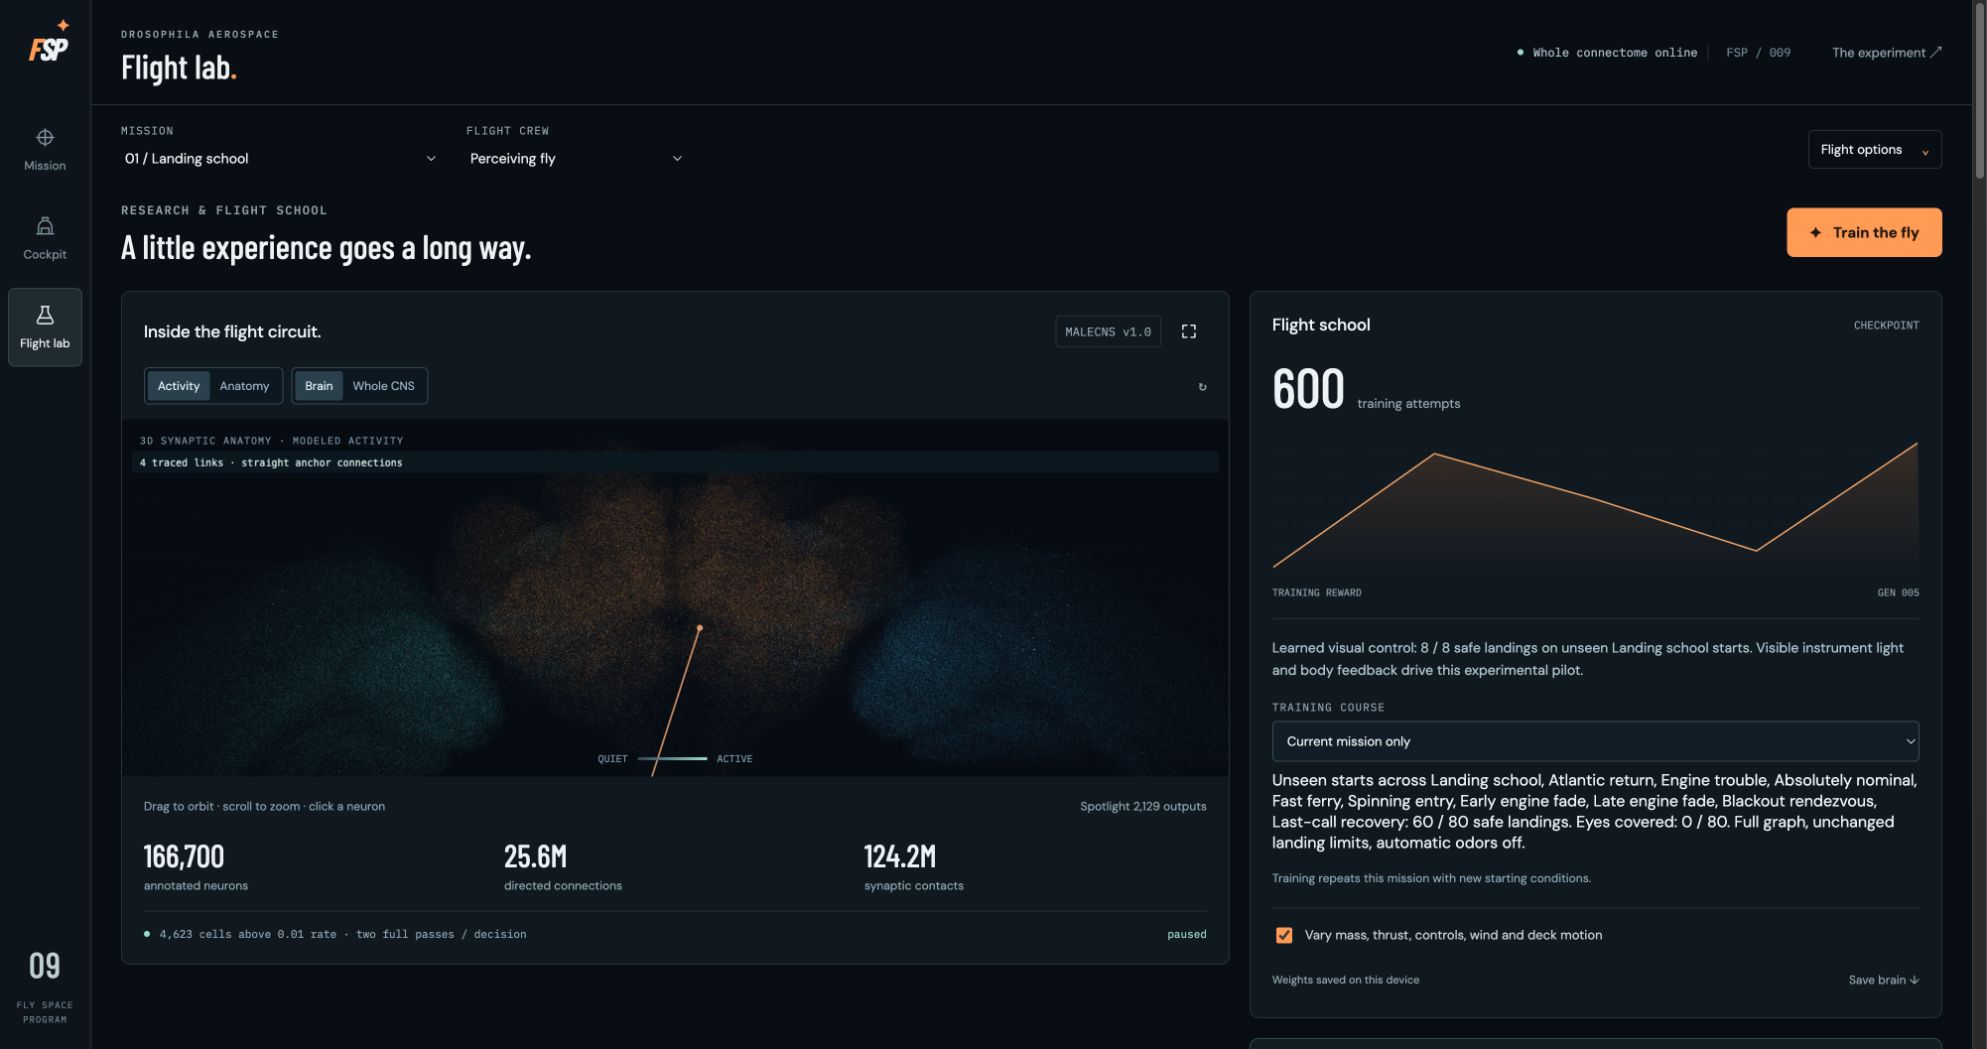
11Flight Lab overview
The Flight Lab shows the complete-connectome explorer and shipped generation-five checkpoint with 600 training attempts. Its five historical reward points are visible after the chart redraw fix; no new training was run for this gallery.
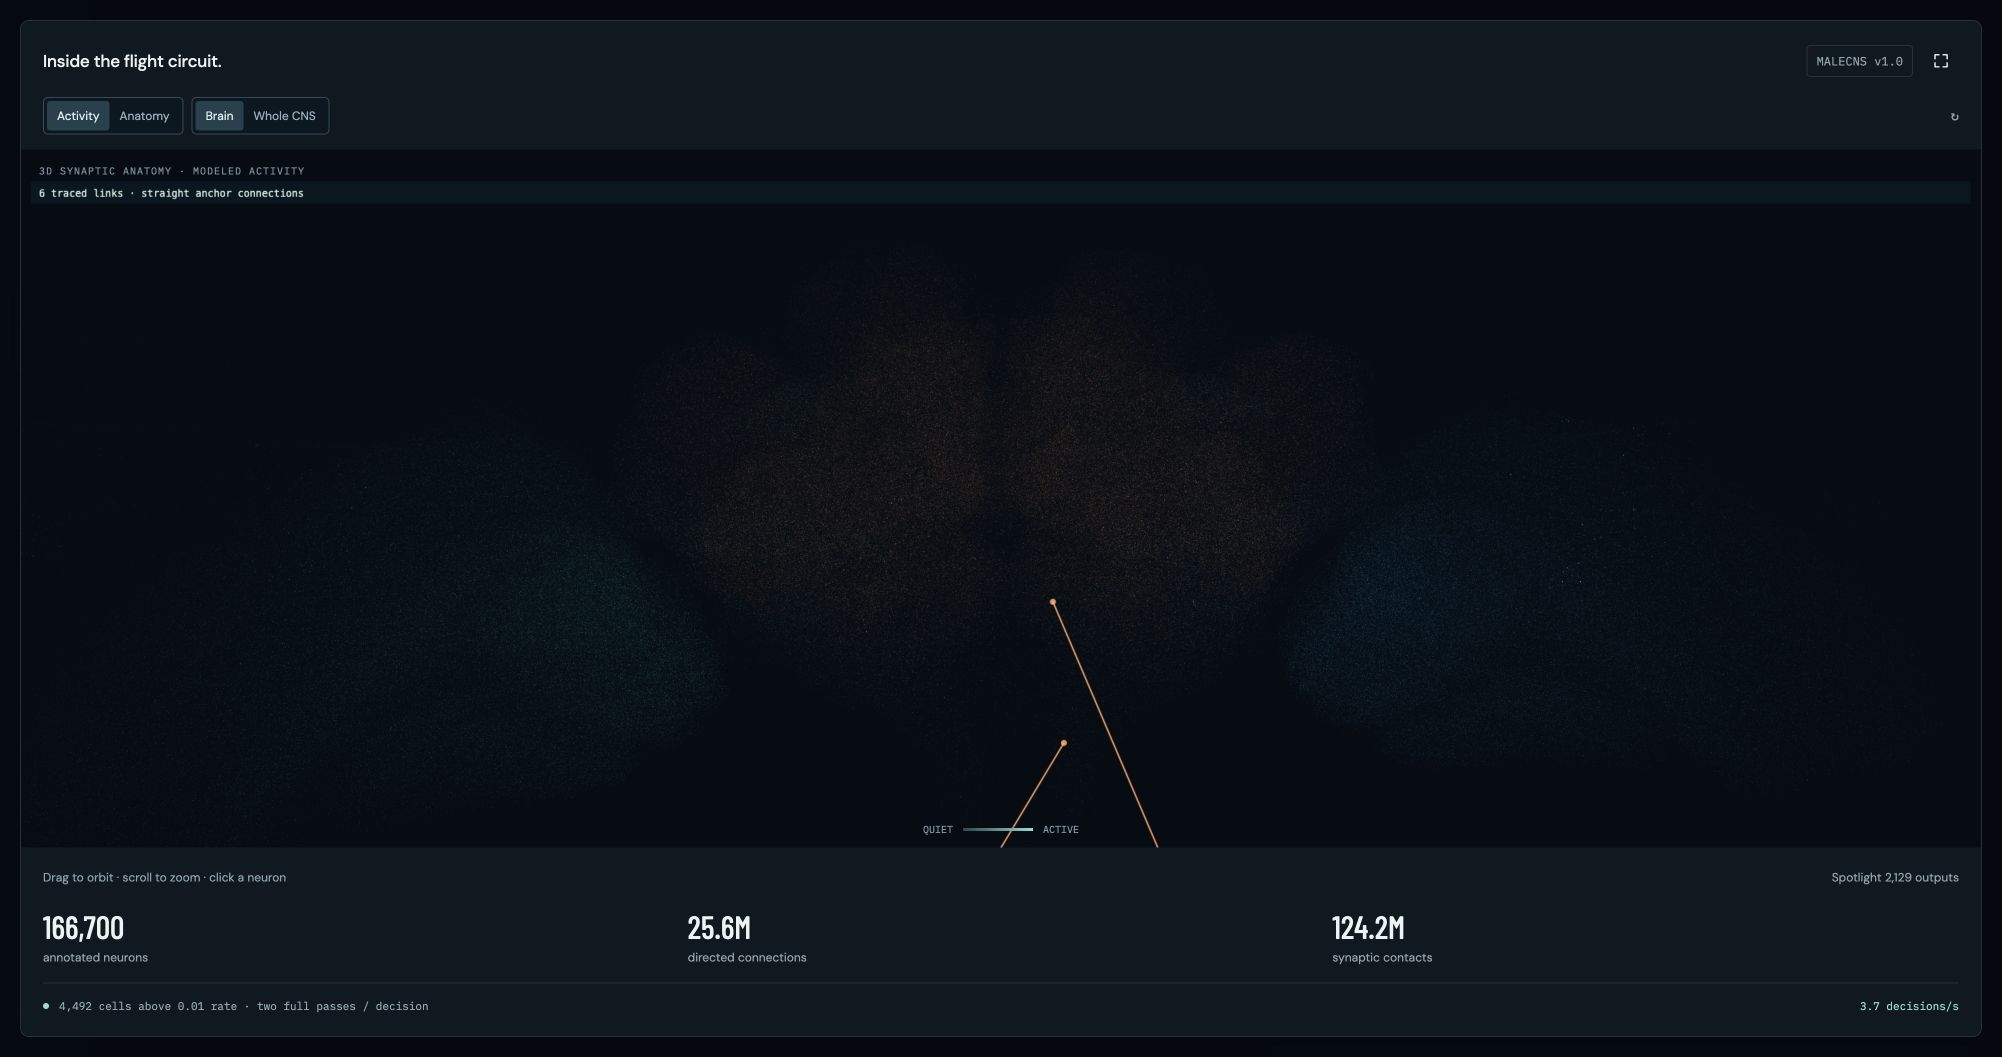
12Modeled neural activity
The expanded brain explorer overlays modeled activity on measured anatomy. At this paused sample, 4,492 cells have modeled rate magnitude above 0.01. Dimness reflects this computed state.
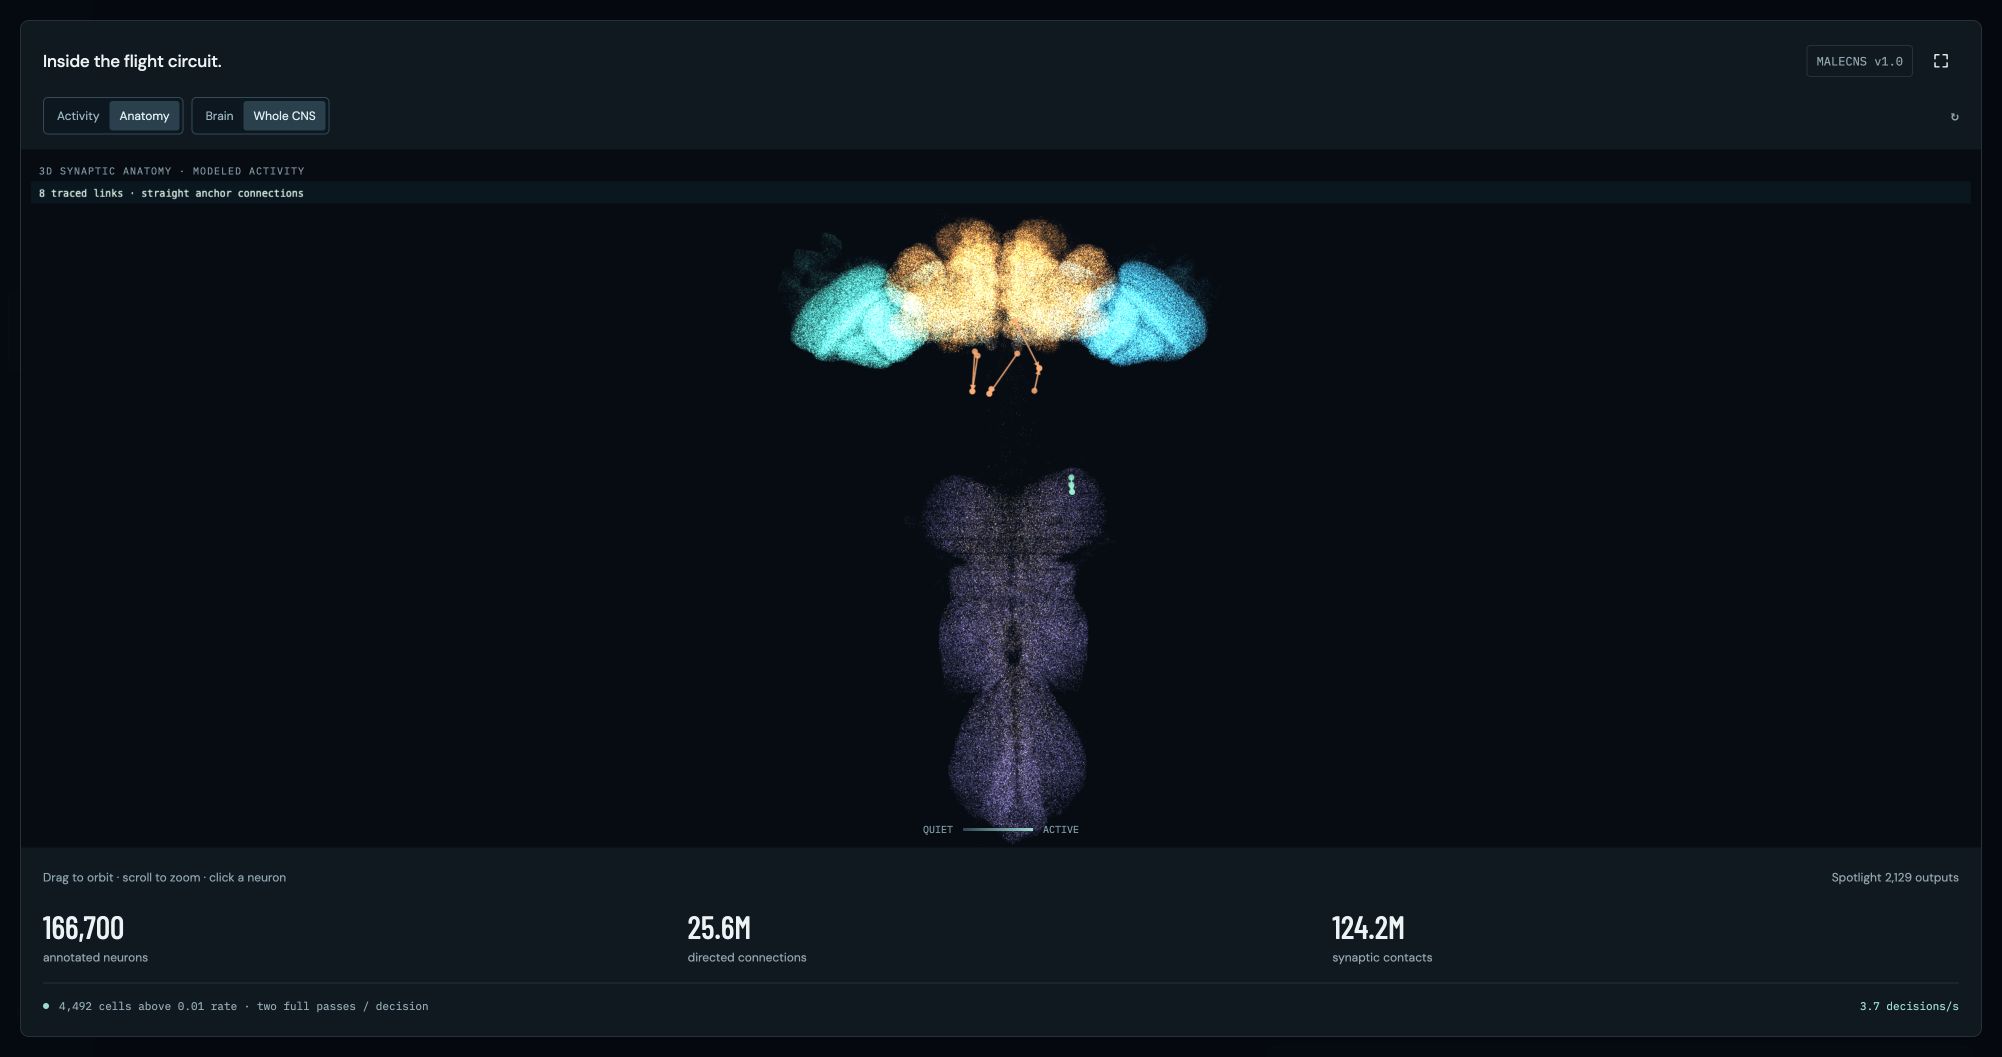
13Whole central nervous system
Anatomy mode and Whole CNS reveal the measured brain and nerve-cord point cloud. These are anatomical locations, not reconstructed neuron skeletons.
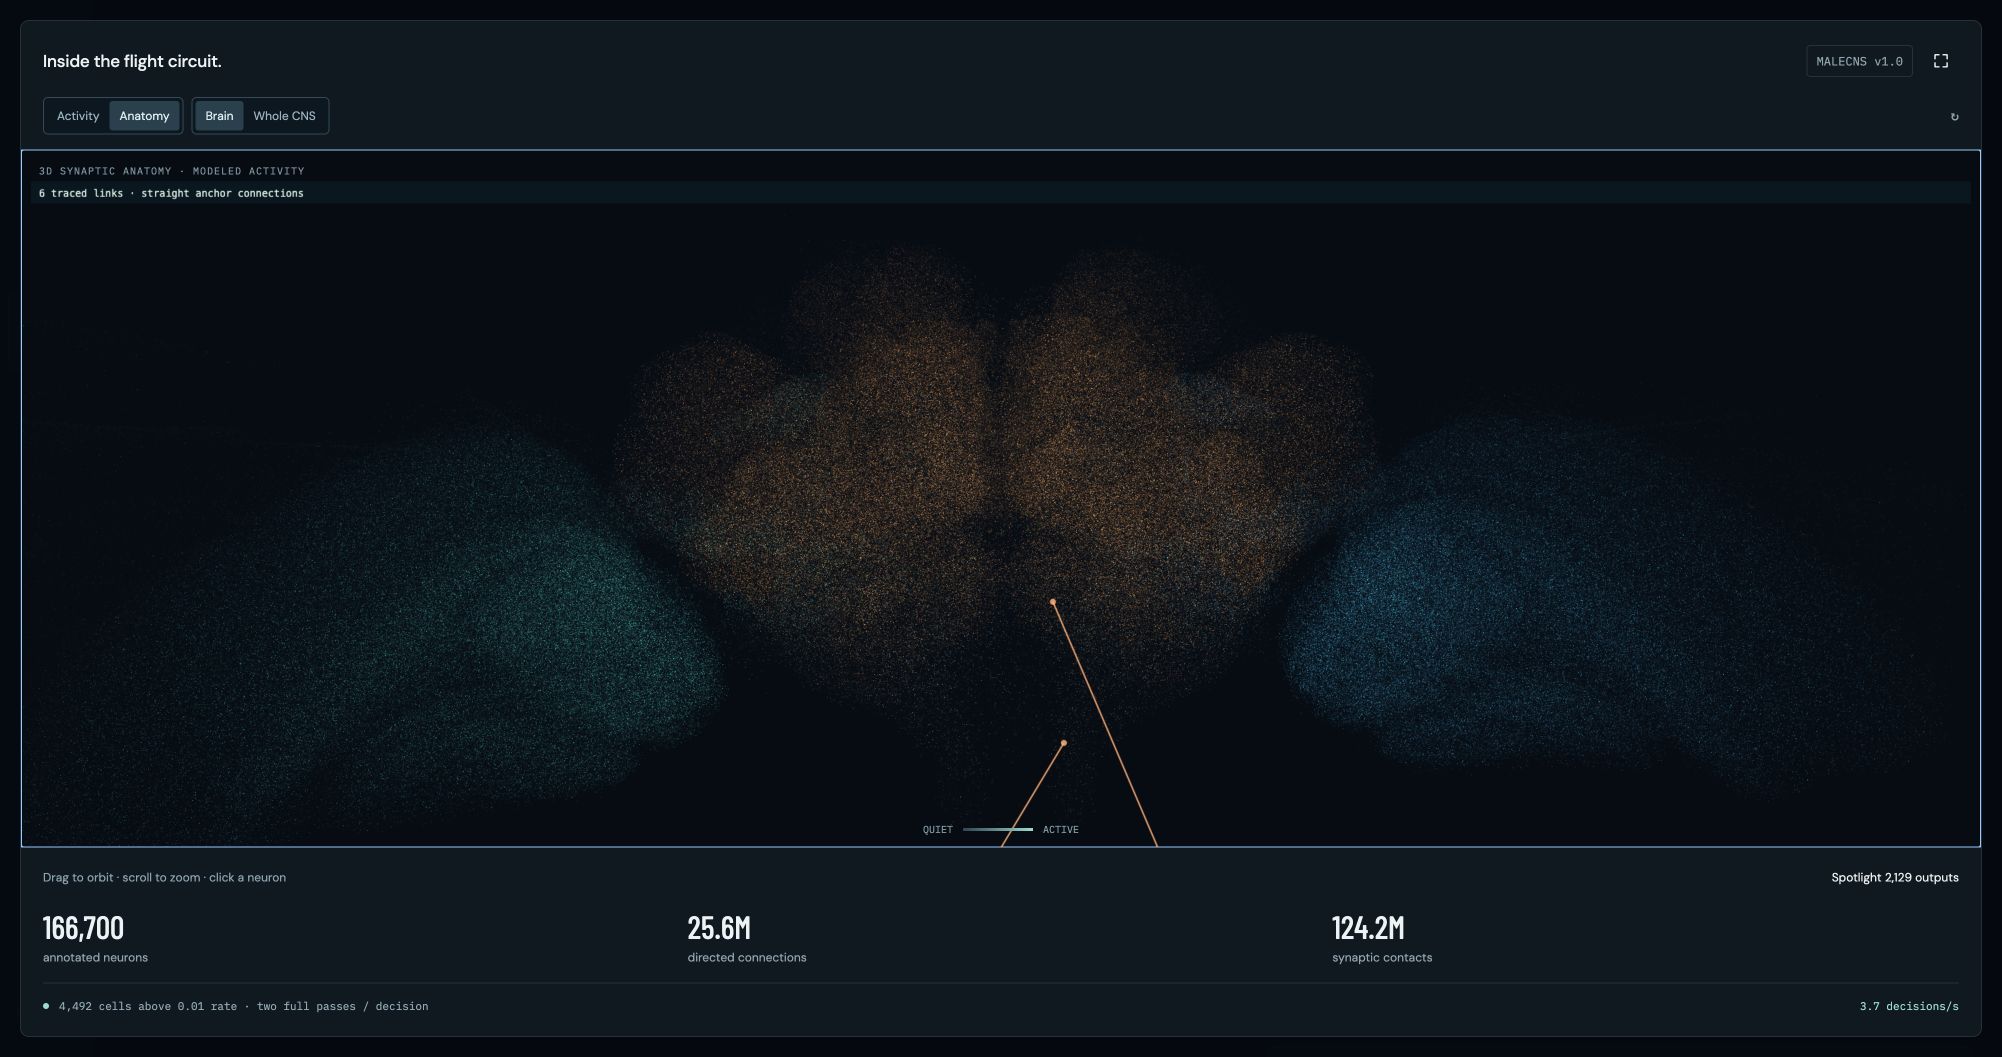
14Brain anatomy
Measured synaptic anatomy in the expanded brain explorer, zoomed out using its keyboard camera controls. Straight highlighted links connect anchors and are not traced neuron arbors.
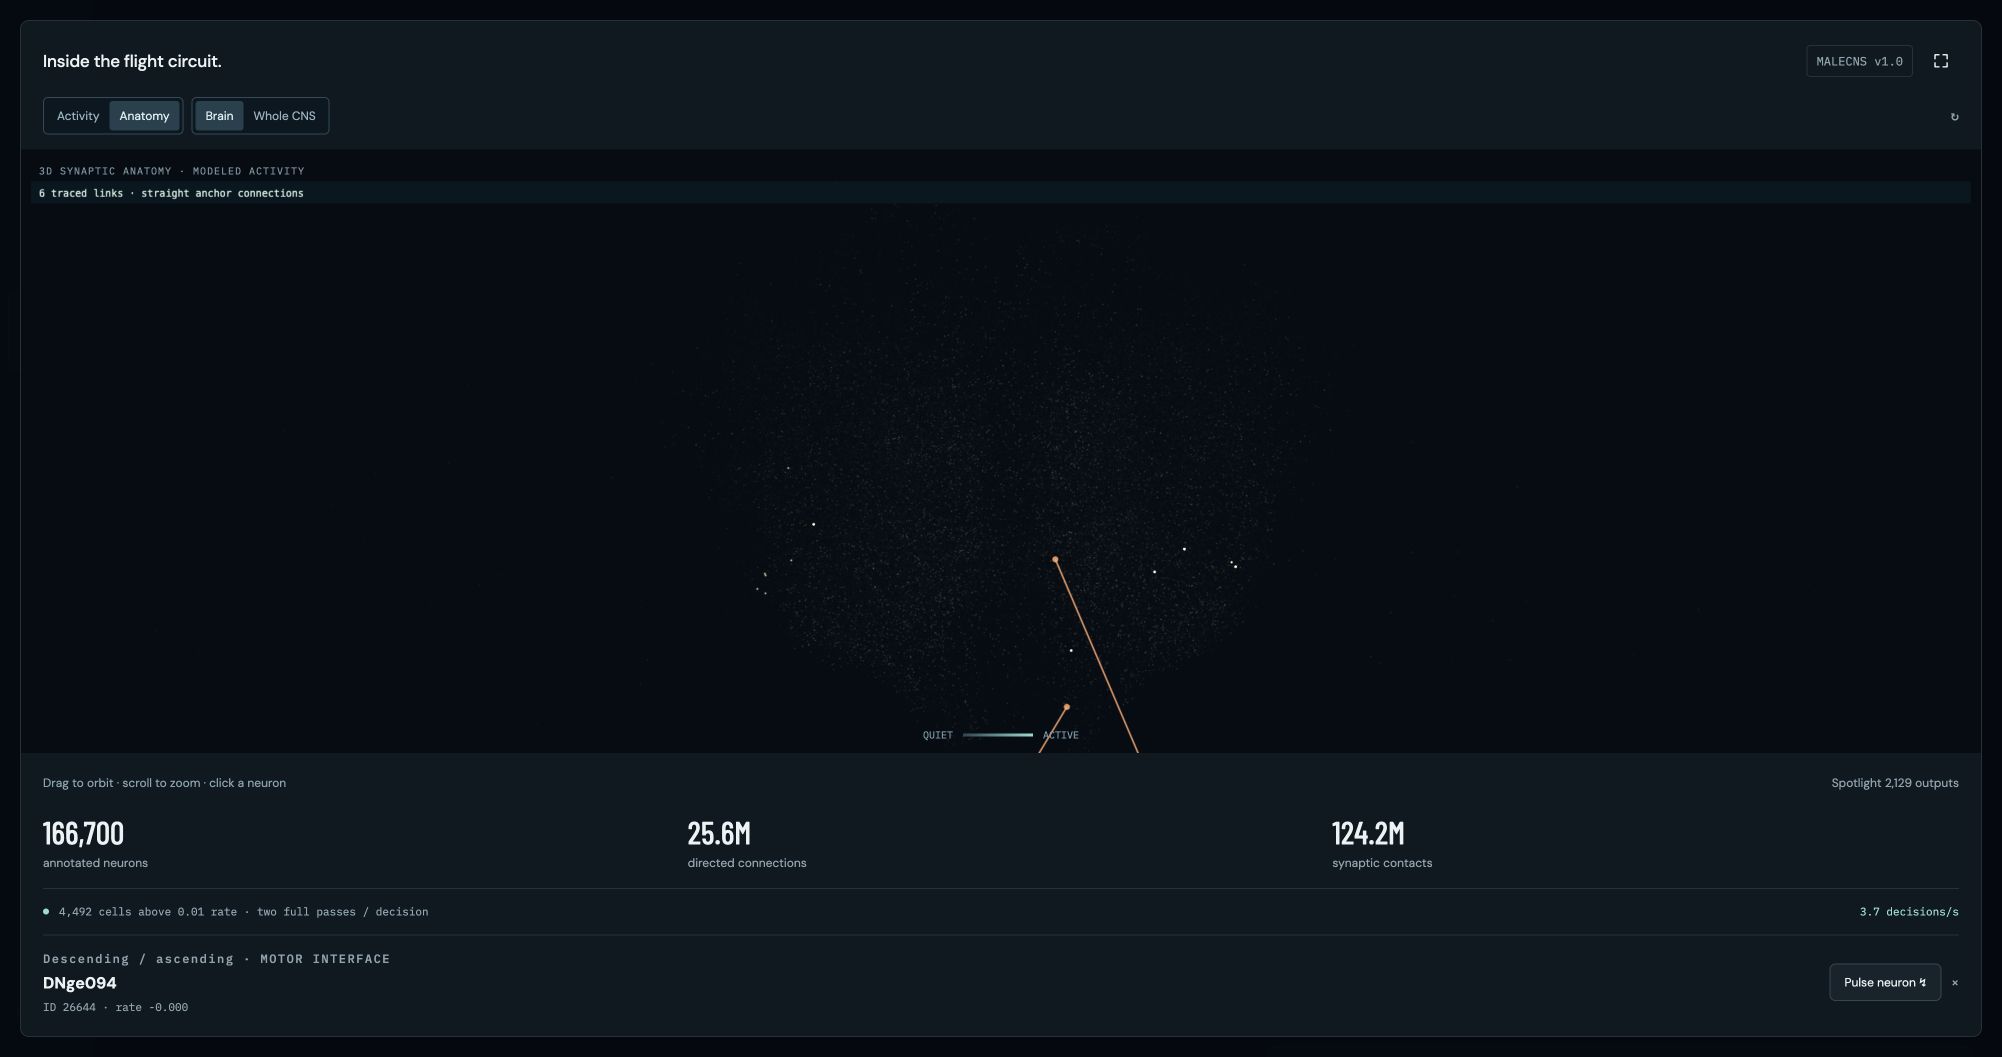
15Output-neuron inspector
An output neuron selected in the measured anatomy: DNge094, ID 26644. The displayed rate is modeled activity; the pulse control has not been activated.
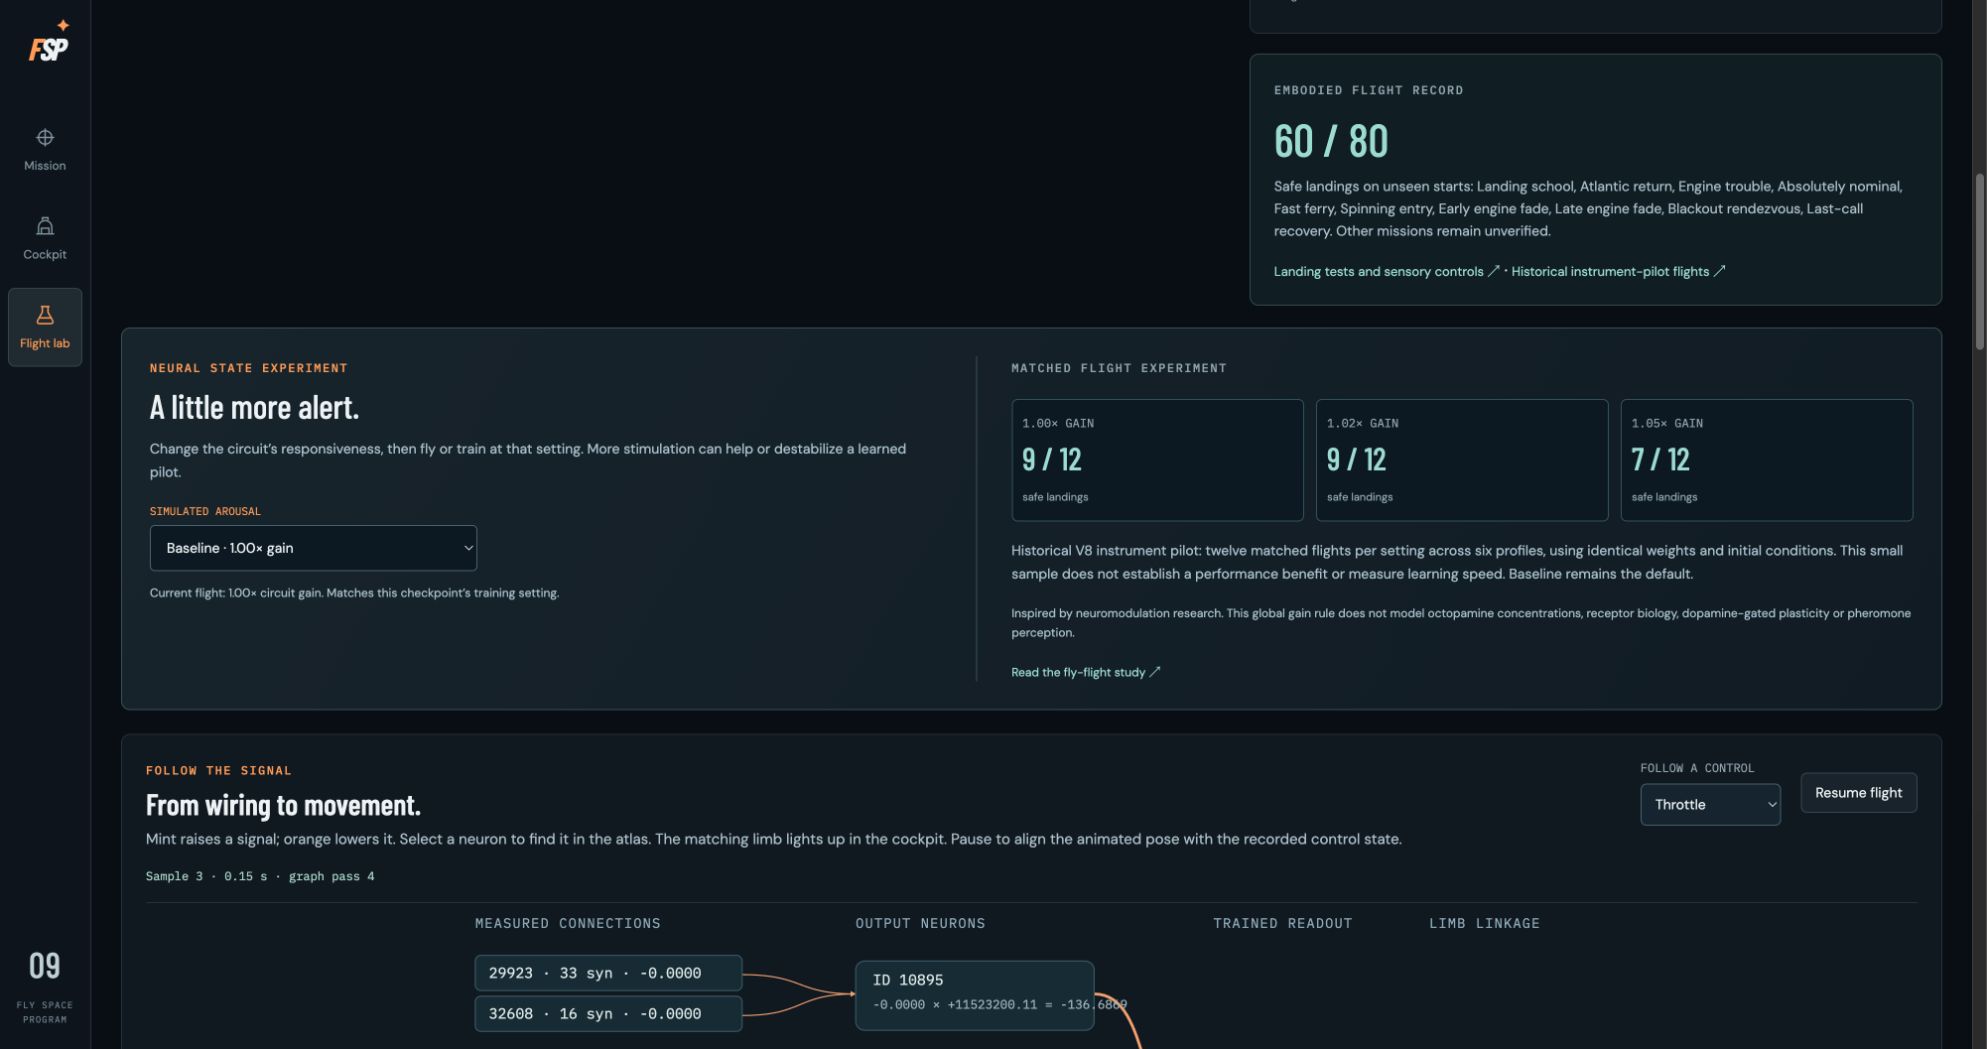
16Neural arousal controls
Baseline global gain and the historical matched instrument-pilot experiment. The 9/12, 9/12 and 7/12 results are a software gain comparison, not biological stimulation measurements.
Follow a decision
Back to top ↑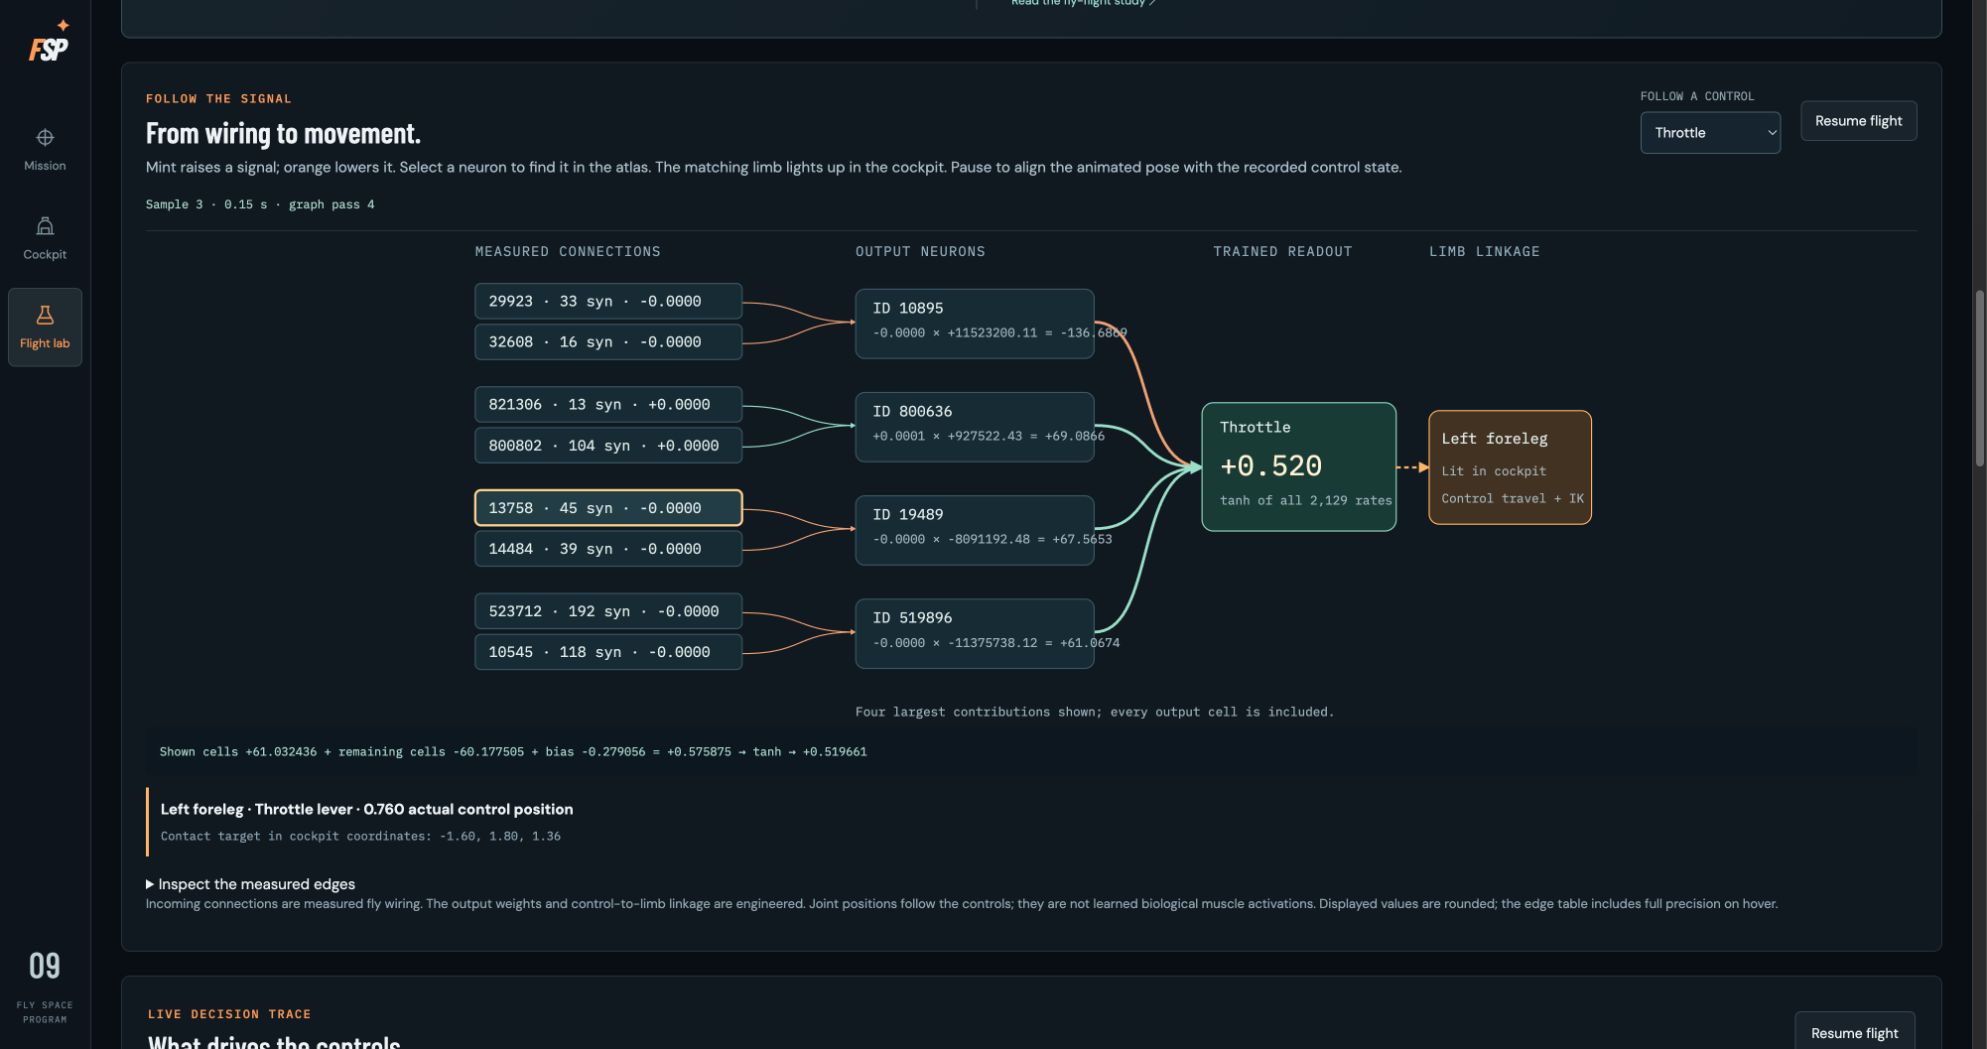
17From wiring to movement
The paused throttle trace shows measured incoming edges, four displayed output cells, the learned readout and authored left-foreleg linkage. The command calculation still uses all 2,129 output cells.
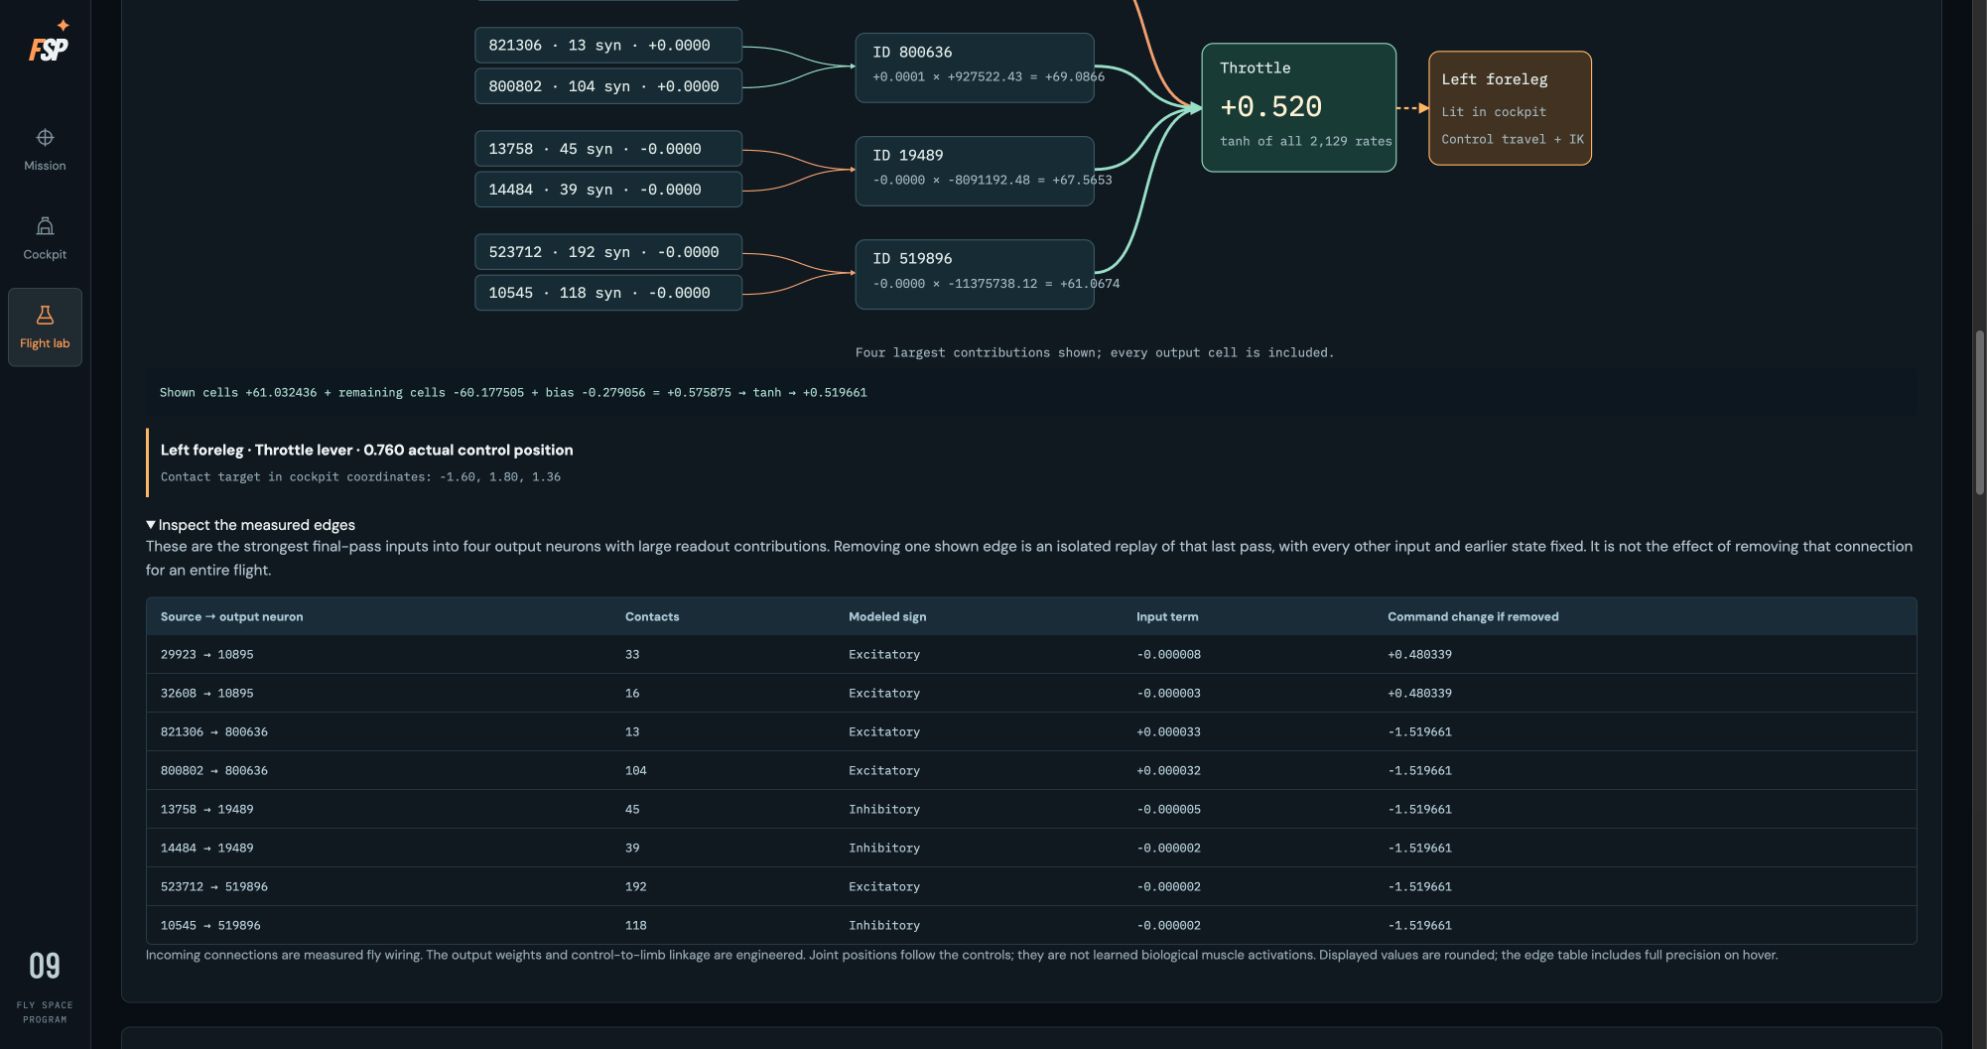
18Measured-edge details
The expanded edge table records source and output IDs, contact counts, modeled signs and isolated final-pass removal effects. These effects are not whole-flight lesion experiments.
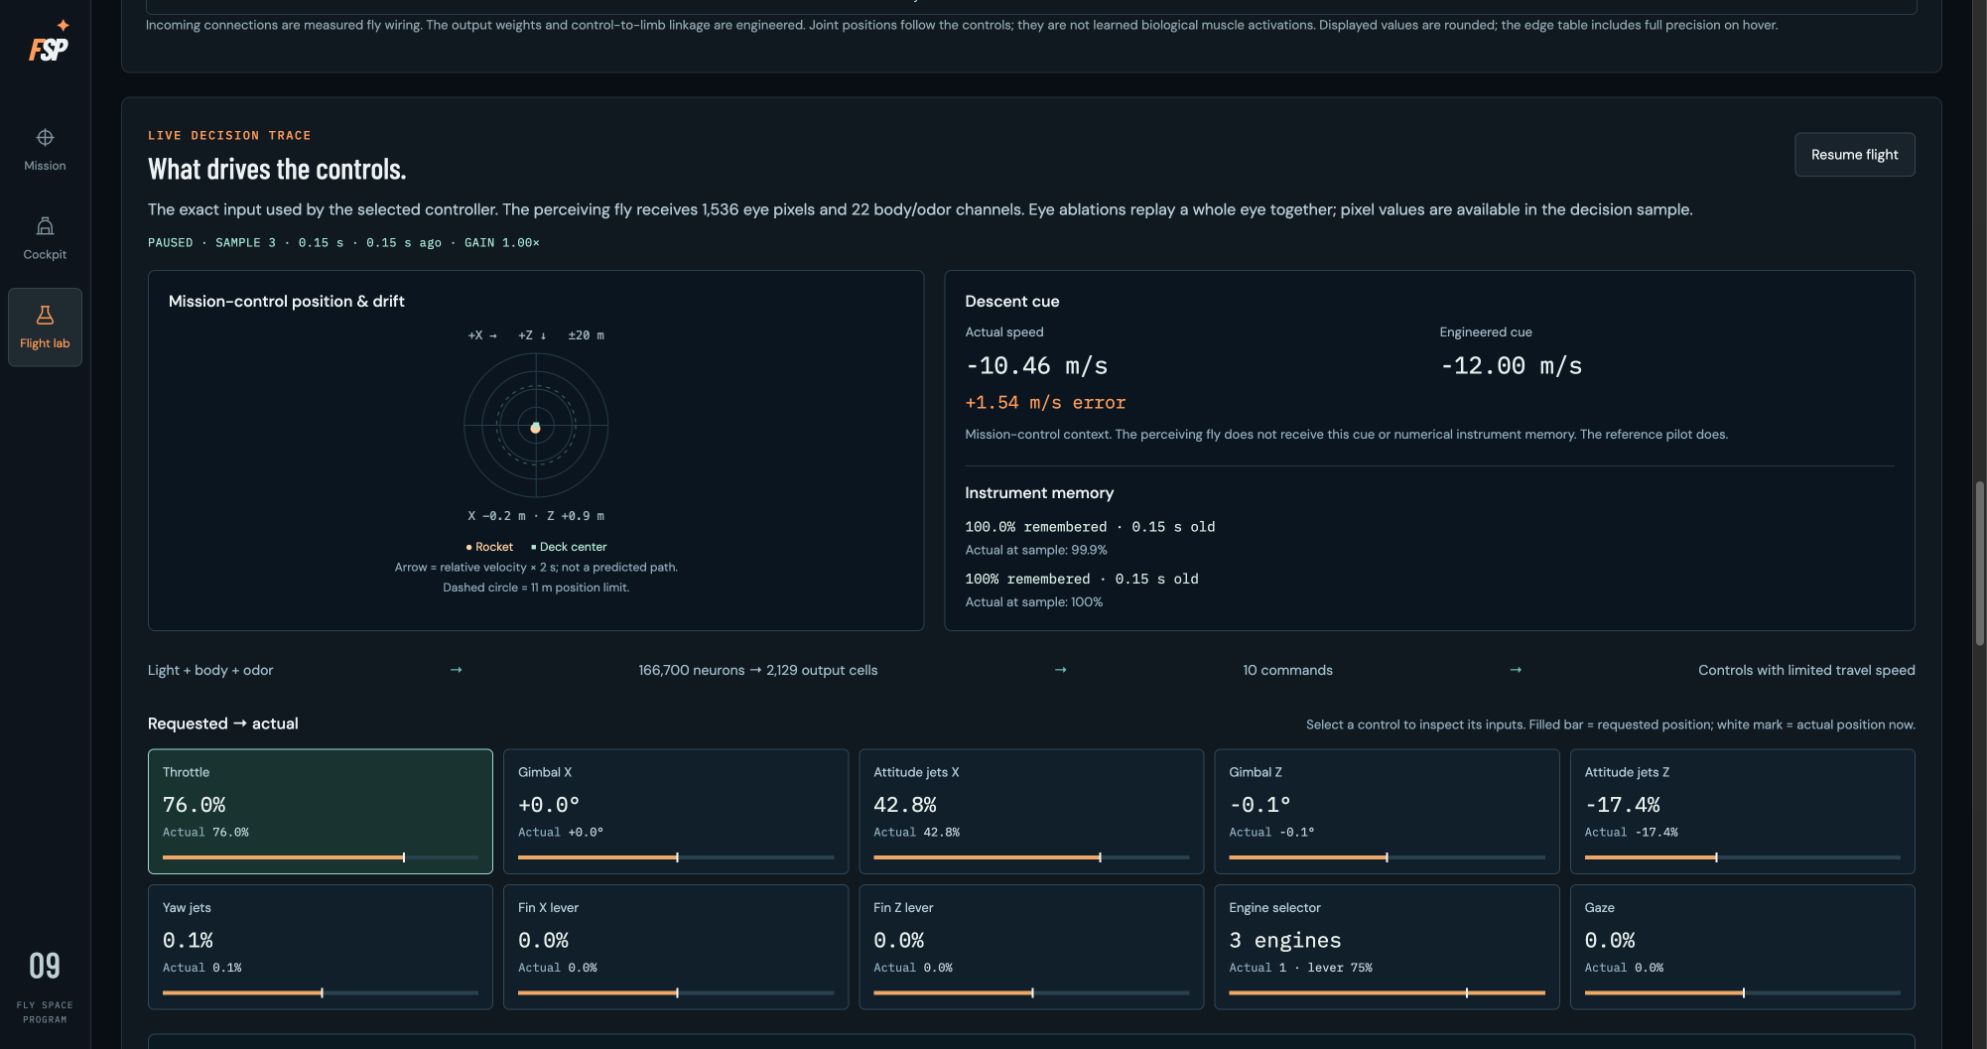
19Live decision trace
A paused sample shows mission-control context and all ten requested versus actual control positions. Numerical descent cues and instrument memory are not inputs to the perceiving fly.
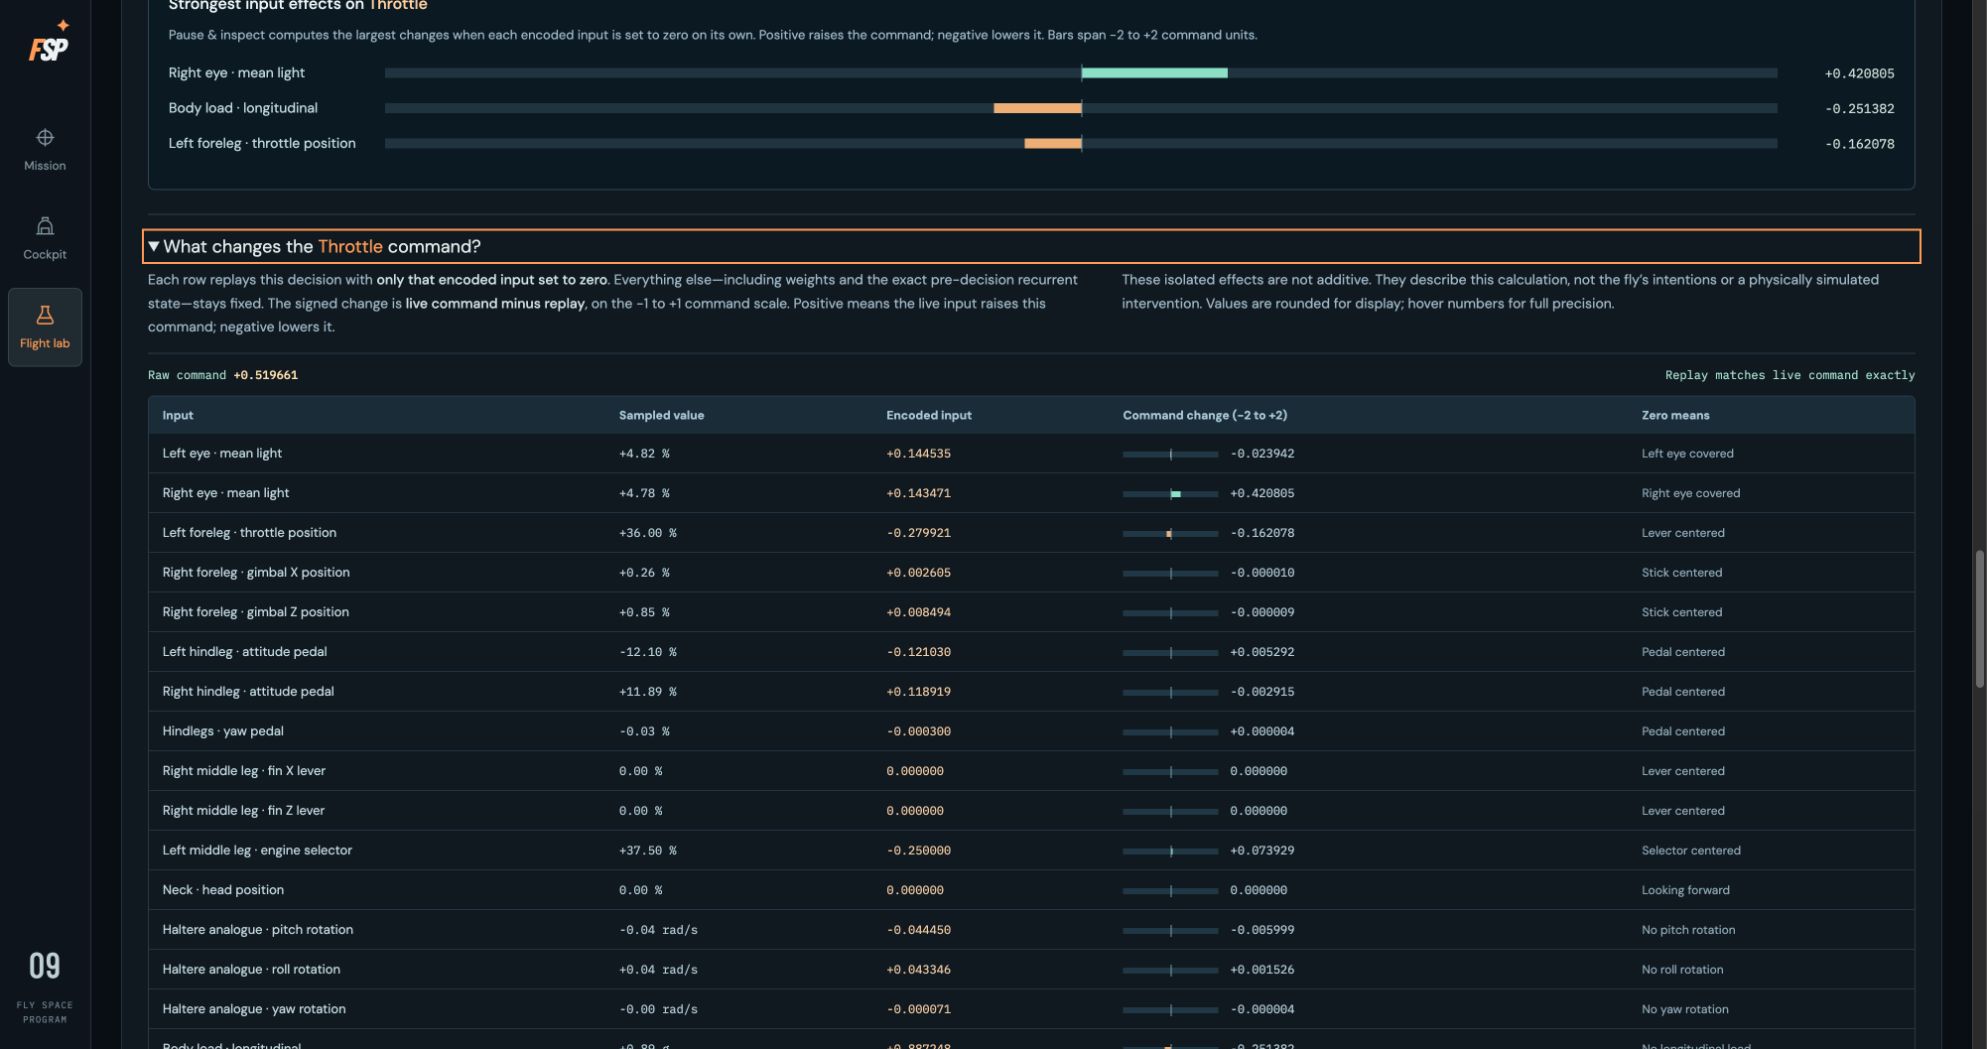
20Exact decision replay
Throttle input-removal effects computed from the exact pre-decision state. The interface confirms the unmodified replay matches the live command exactly; isolated effects are not additive or statements about intentions.
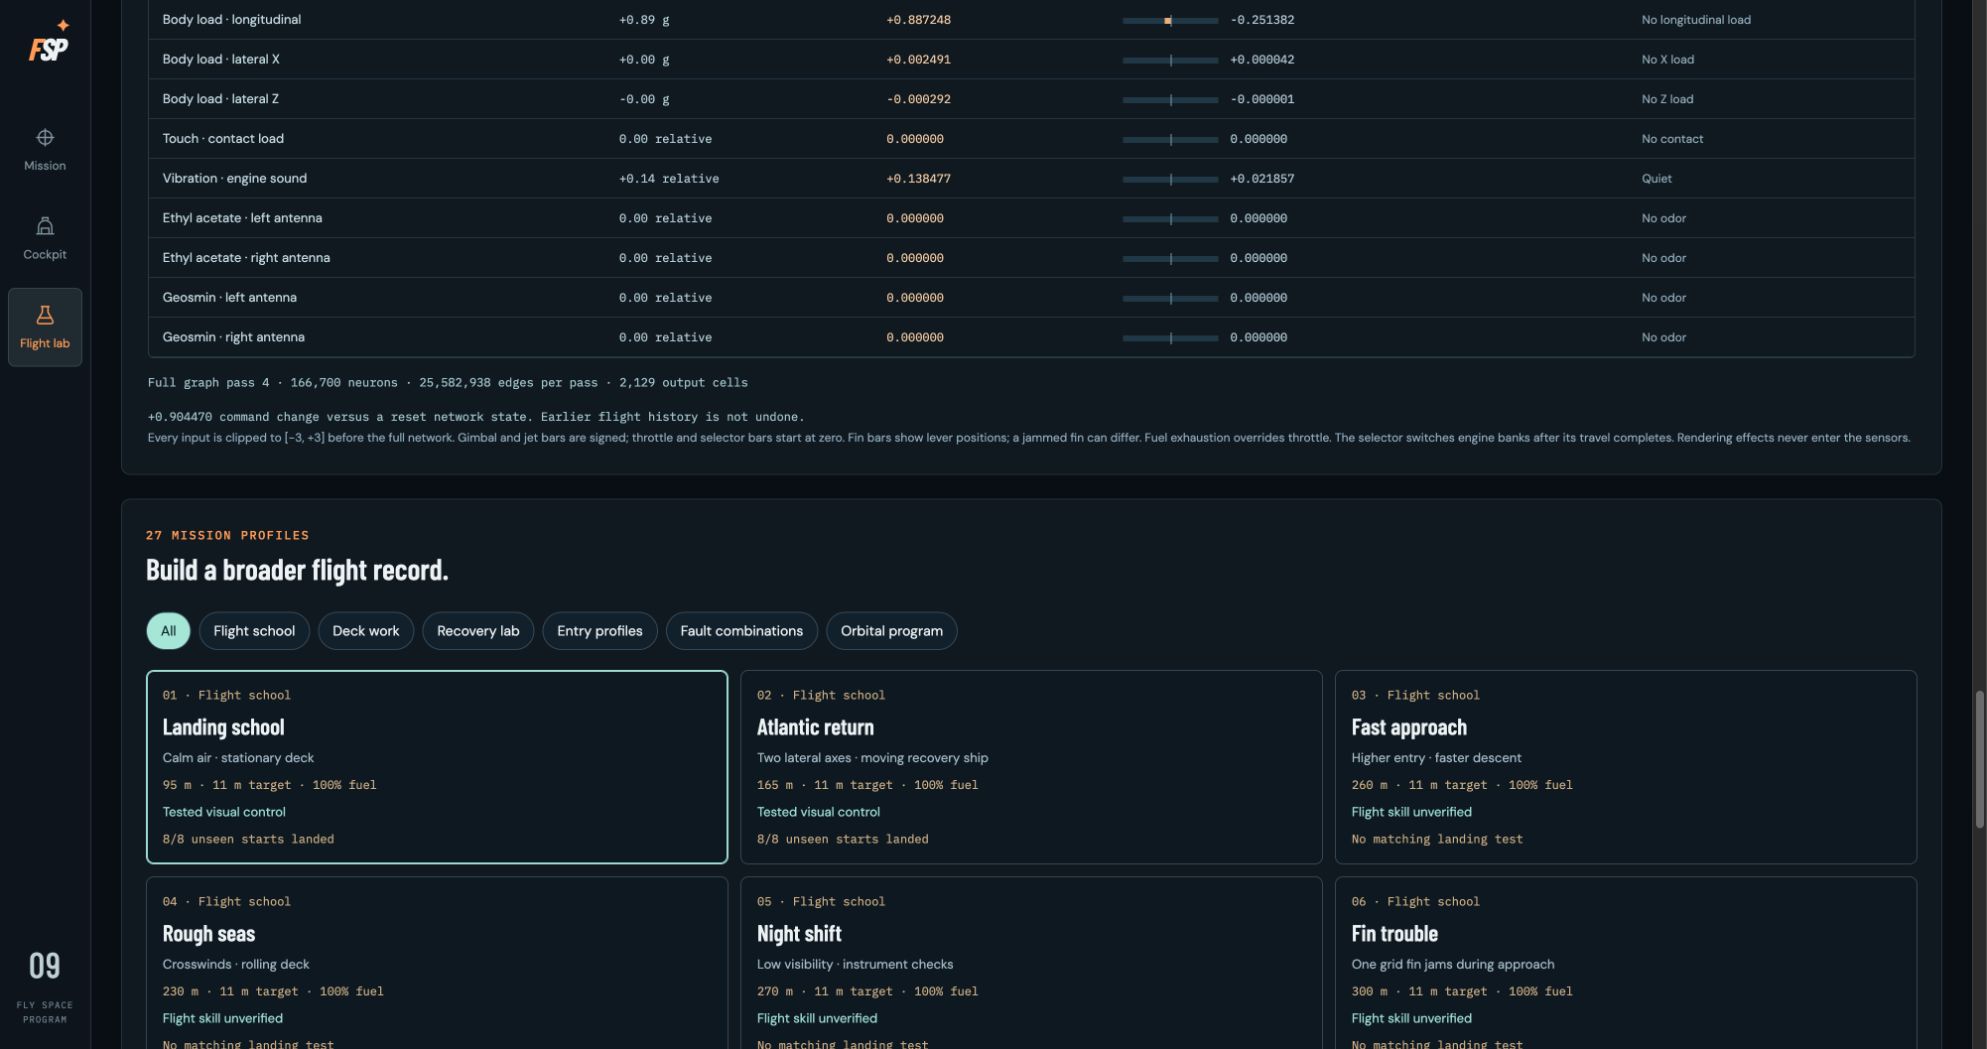
21Body and odor replay rows
The remainder of the sensory-effect table includes body loads, contact, vibration and receptor-specific odor channels, followed by the recurrent-state comparison and command-scale notes.
Choose a mission
Back to top ↑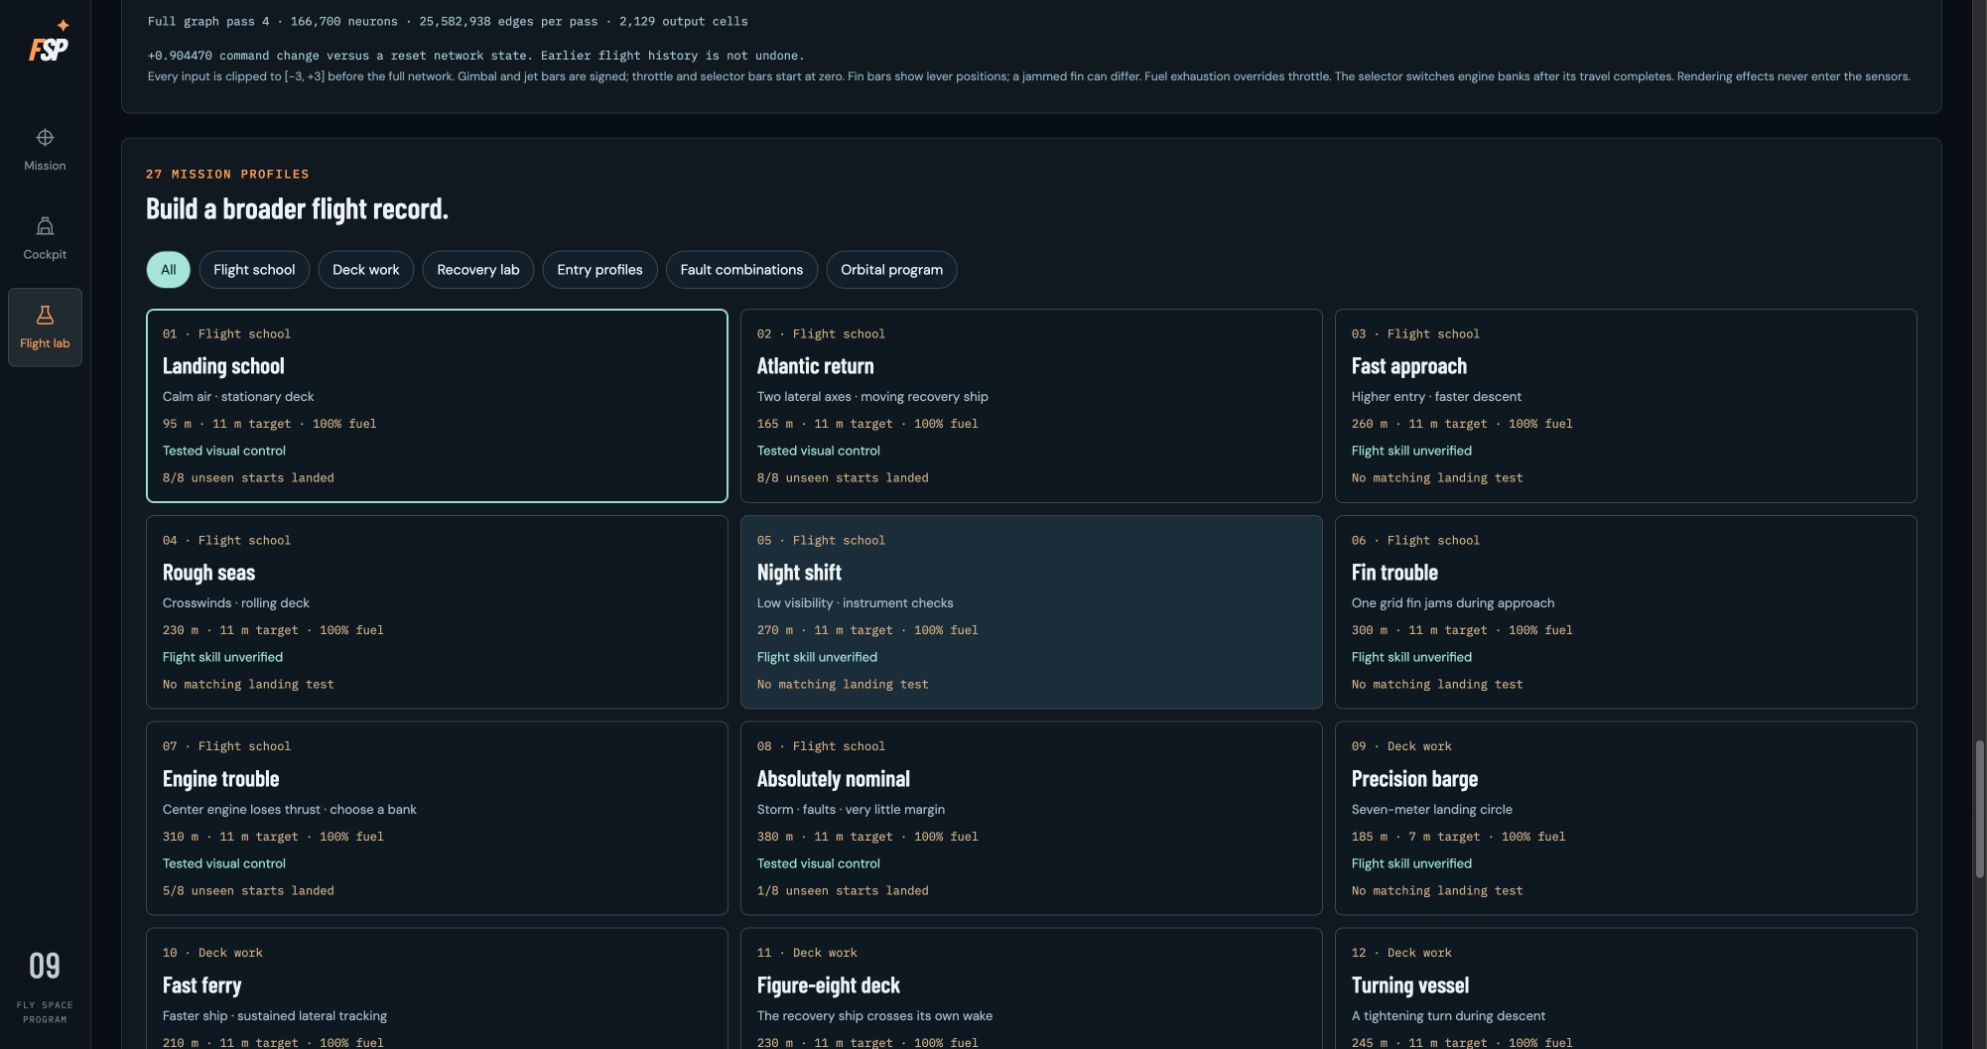
22Mission profile catalogue
The mission catalogue separates tested landing profiles from unverified conditions. Per-profile counts come from the shipped unseen-start evaluation, not this browsing session.
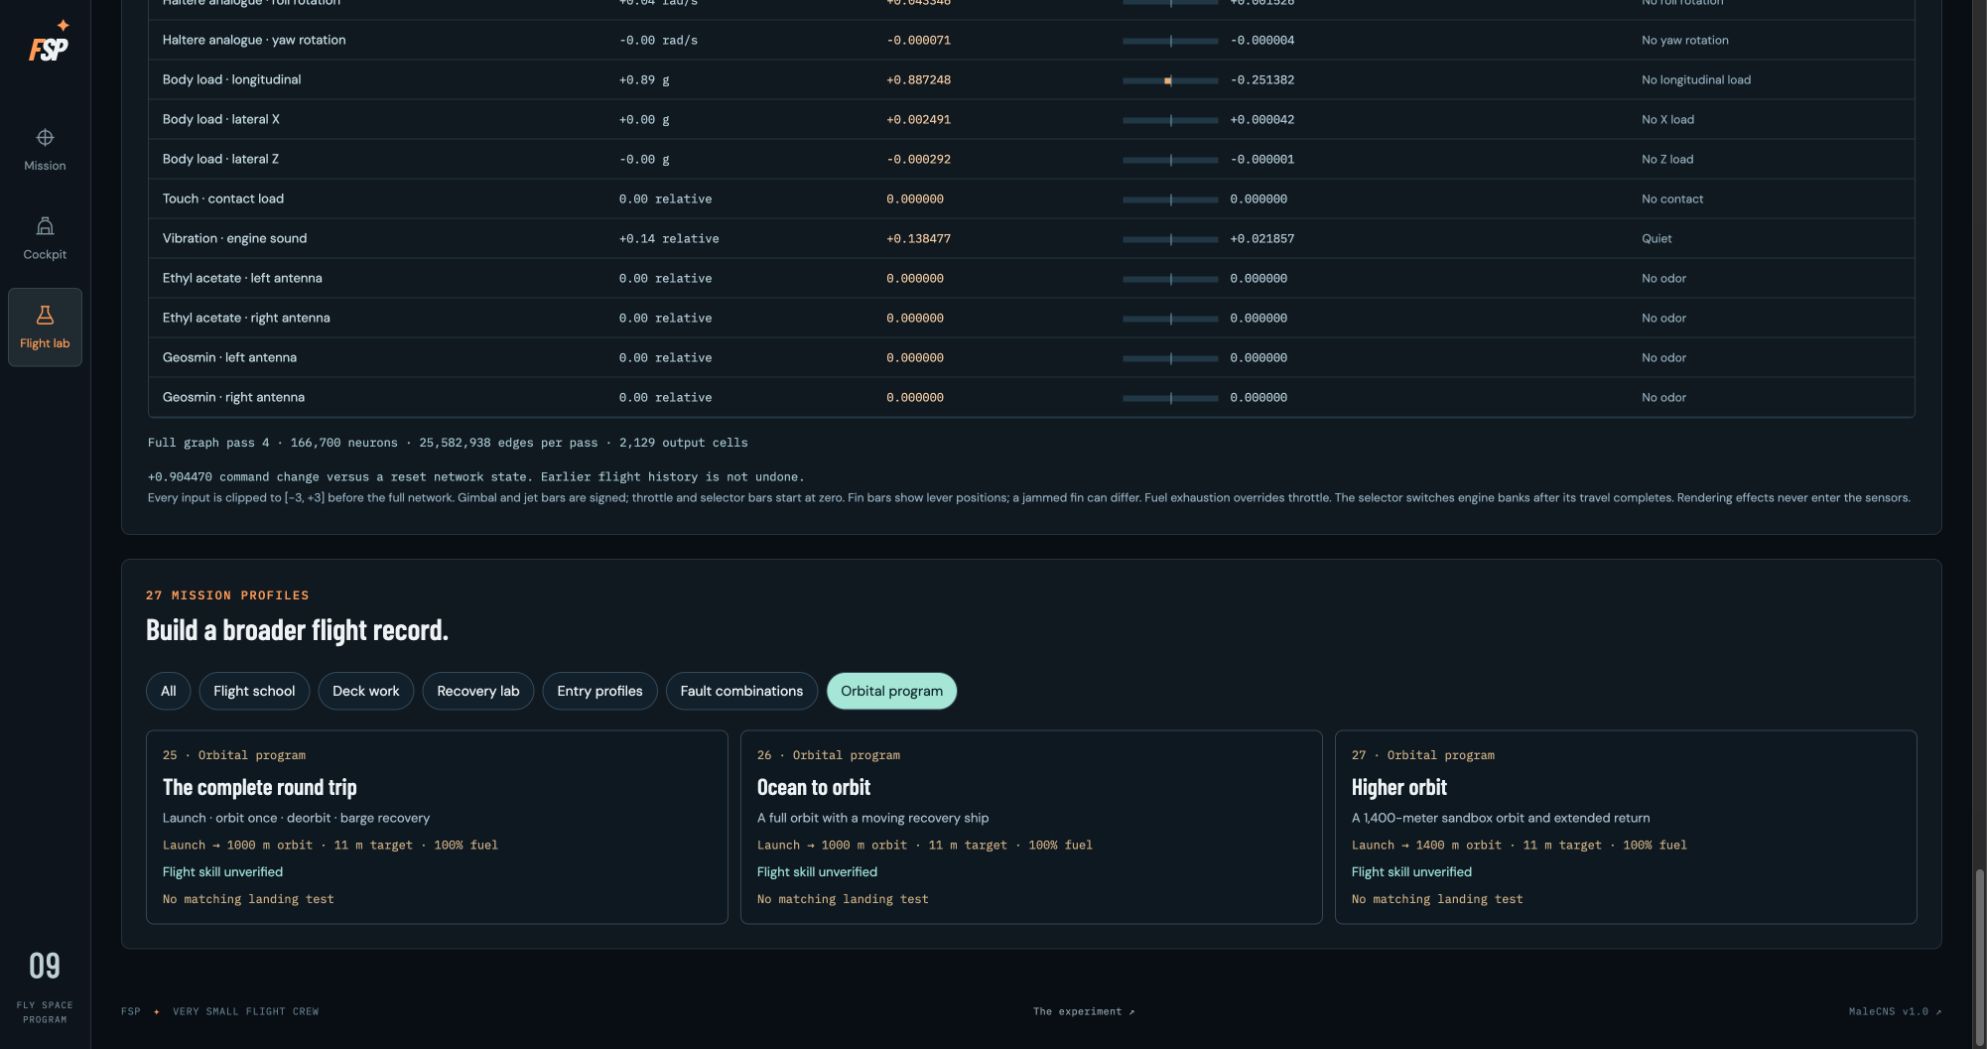
23Orbital mission profiles
The three orbital profiles are explicitly marked unverified for the perceiving fly. These cards describe available scenarios, not demonstrated orbital skill.
The experiment and its evidence
Back to top ↑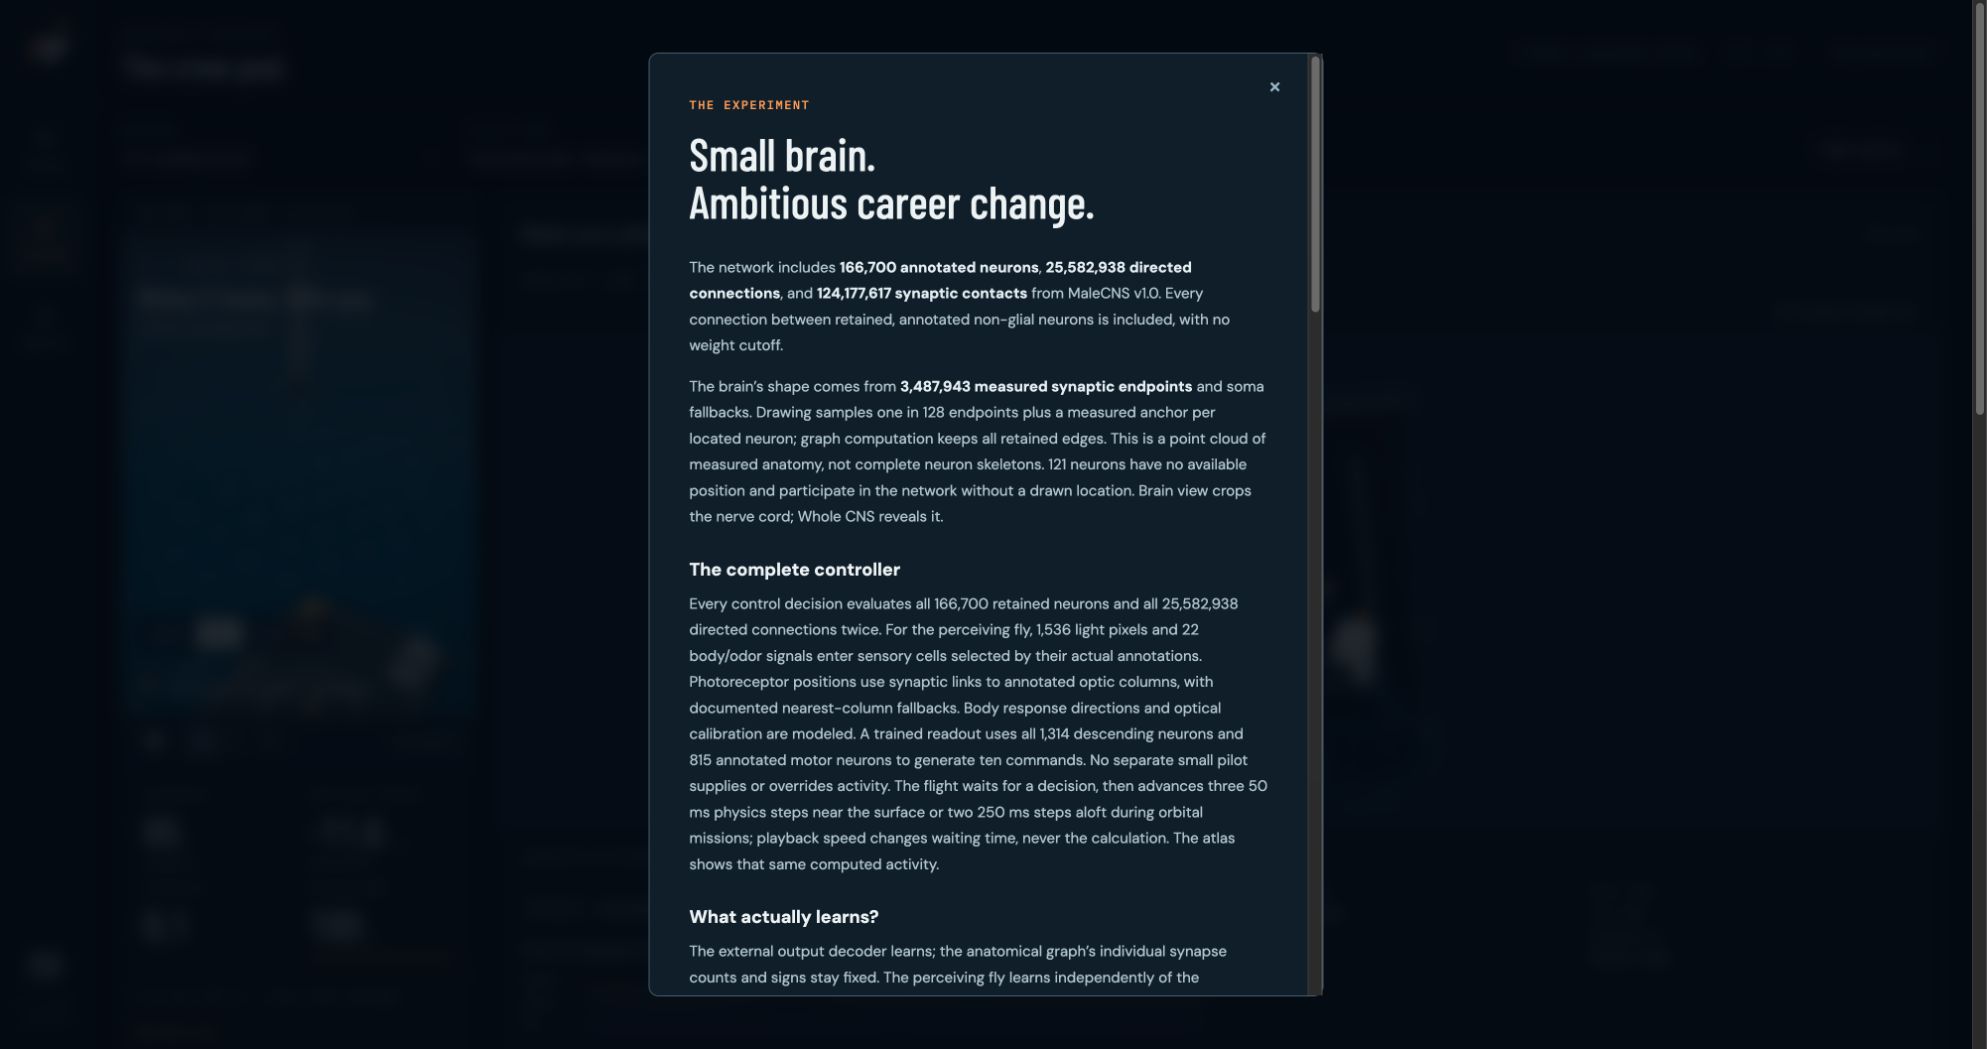
27The experiment: anatomy and controller
The experiment dialog explains the retained connectome, measured anatomical positions and complete controller. It distinguishes sampled drawing geometry from full-graph computation.
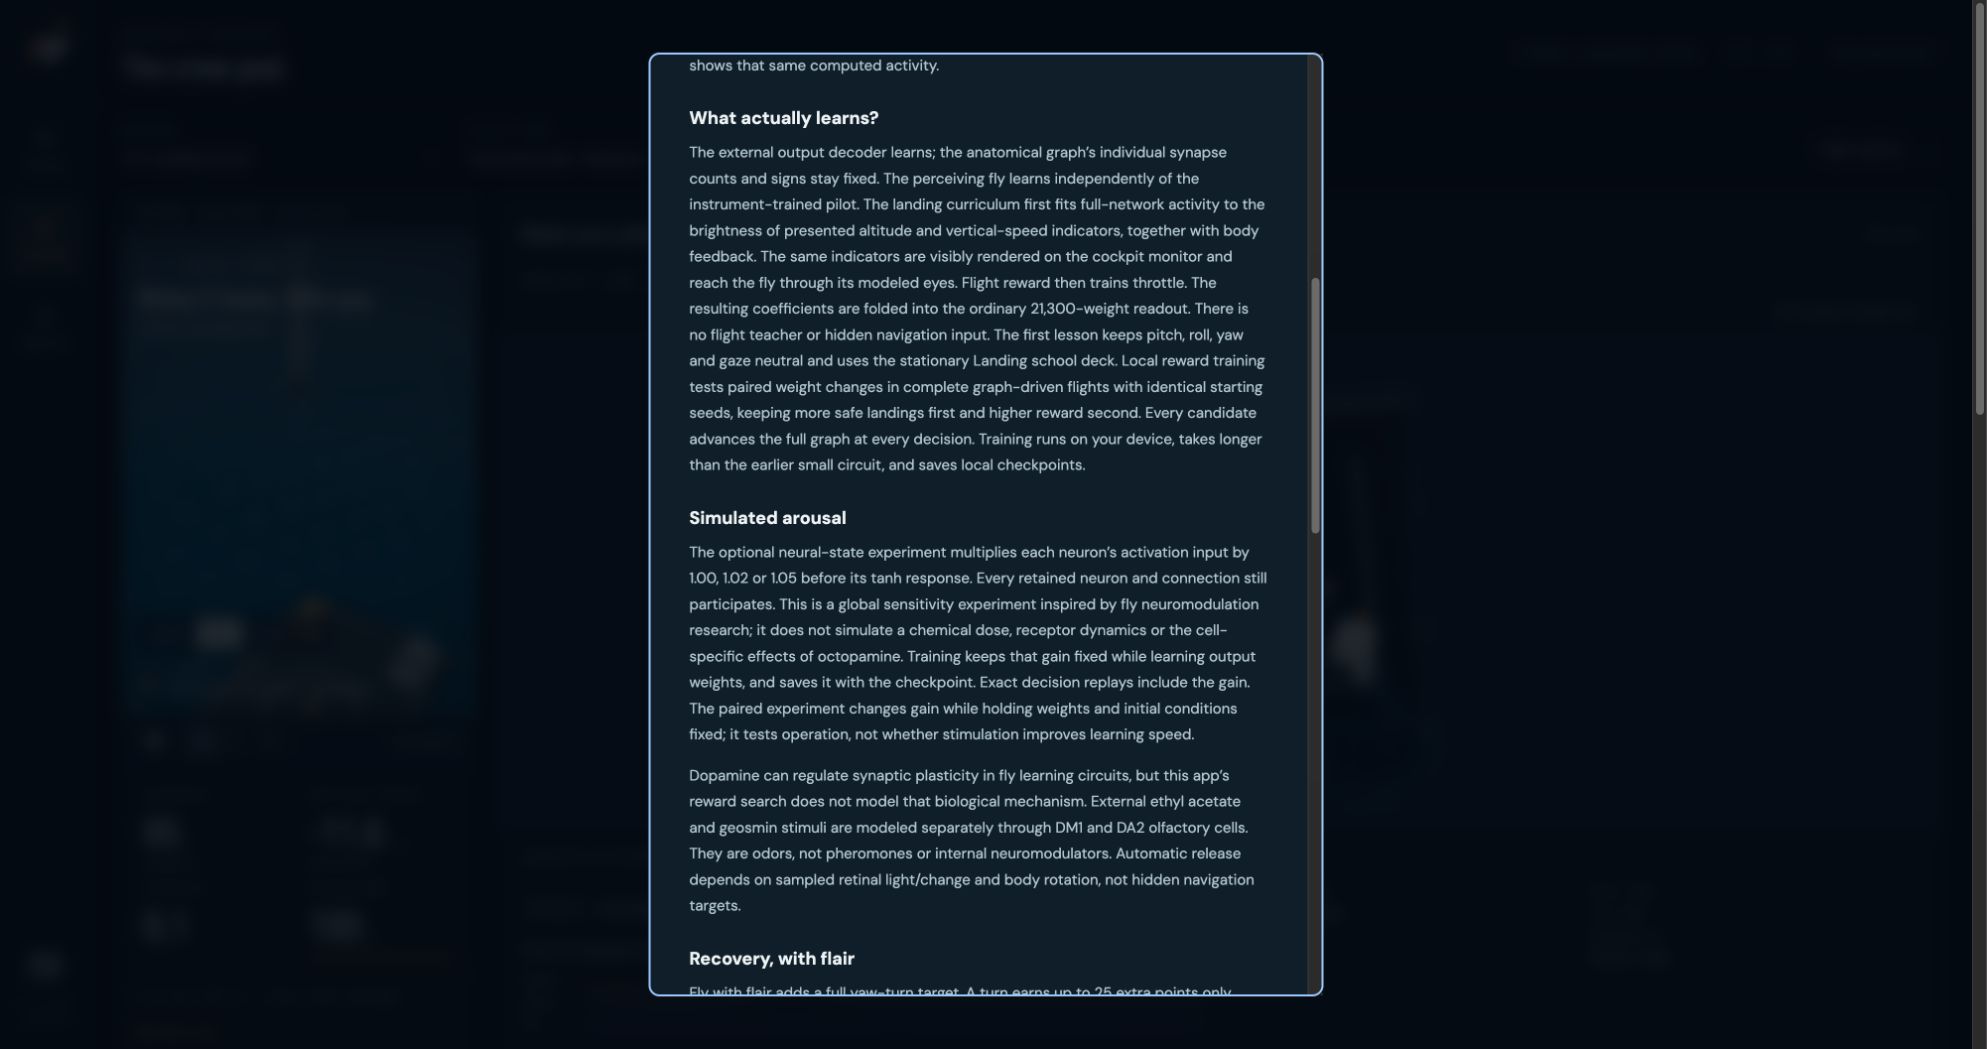
28The experiment: learning and arousal
The dialog describes the external decoder-learning procedure, the fixed anatomical graph and the limits of the global neural-gain experiment.
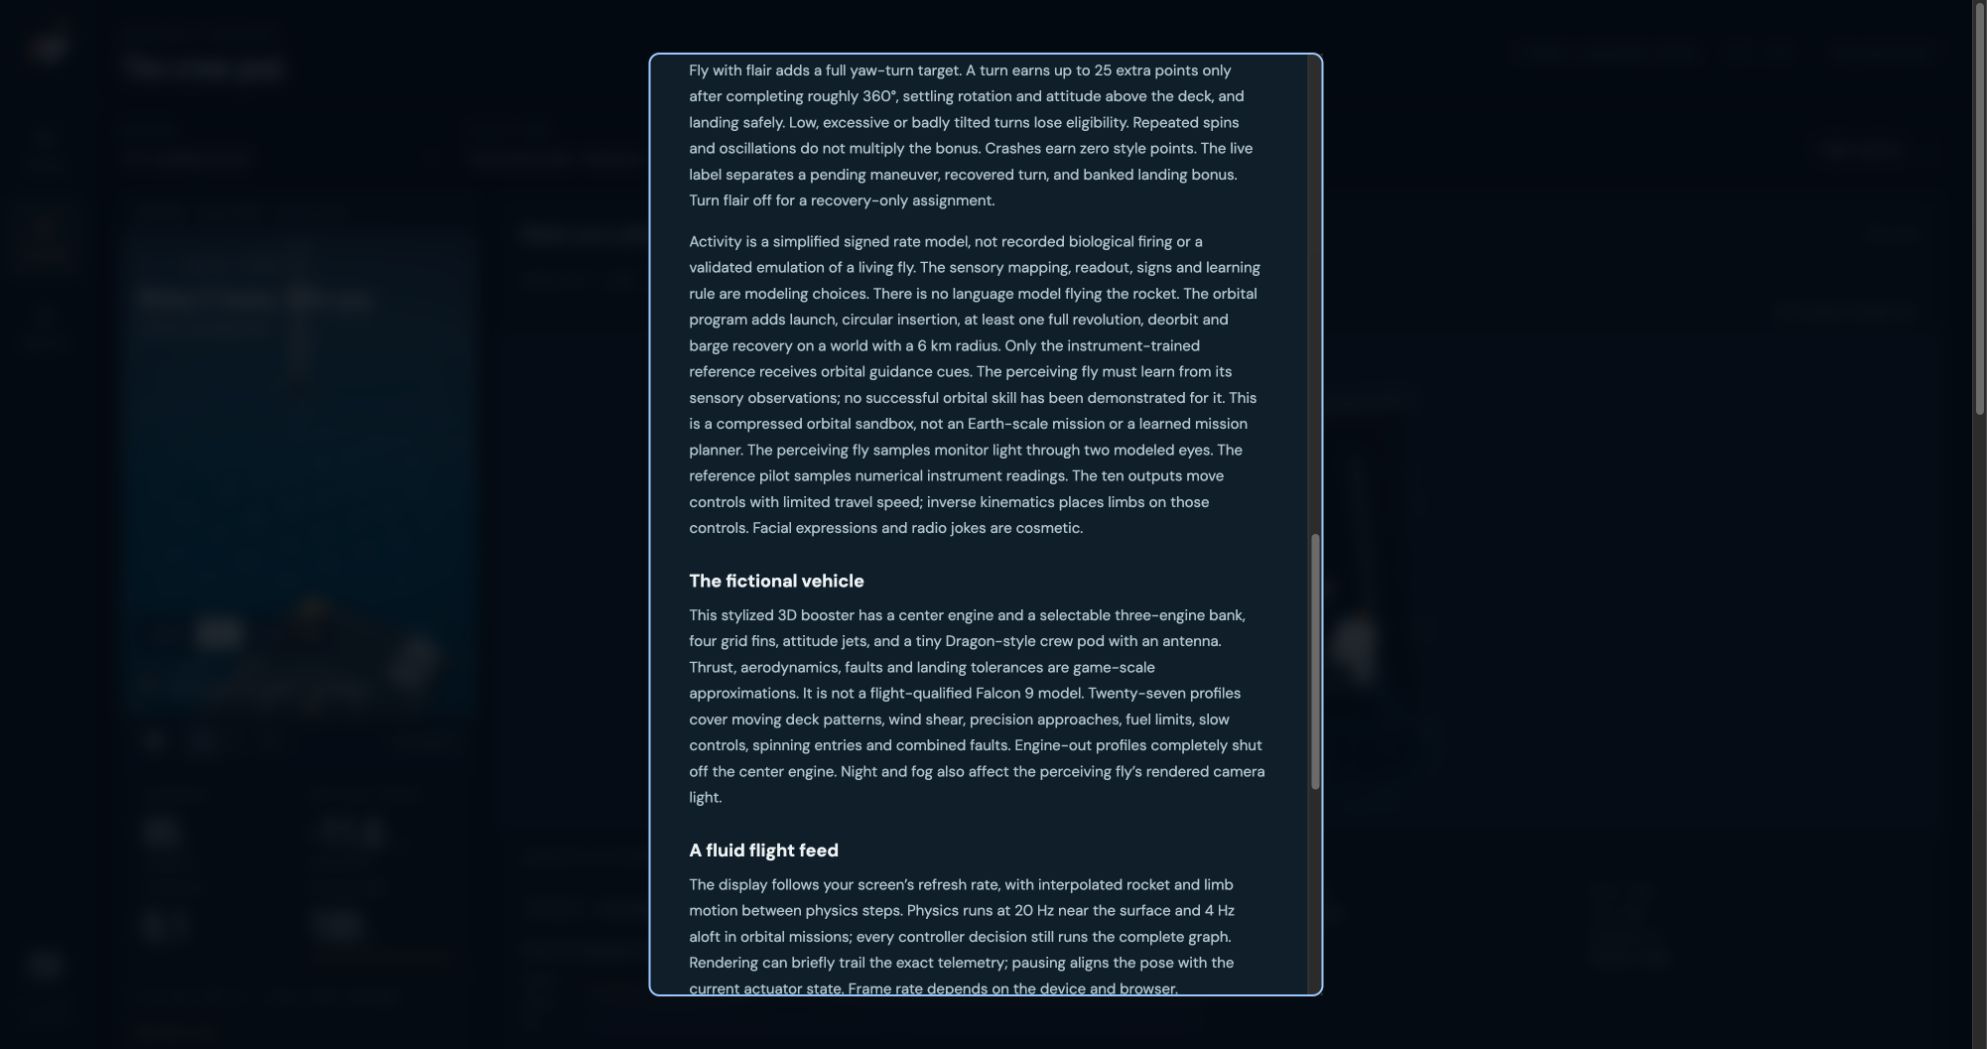
29The experiment: model limitations
The experiment explains recovery scoring, simplified neural activity, the lack of demonstrated orbital skill for the perceiving fly, and the fictional vehicle. These are software-model limitations.
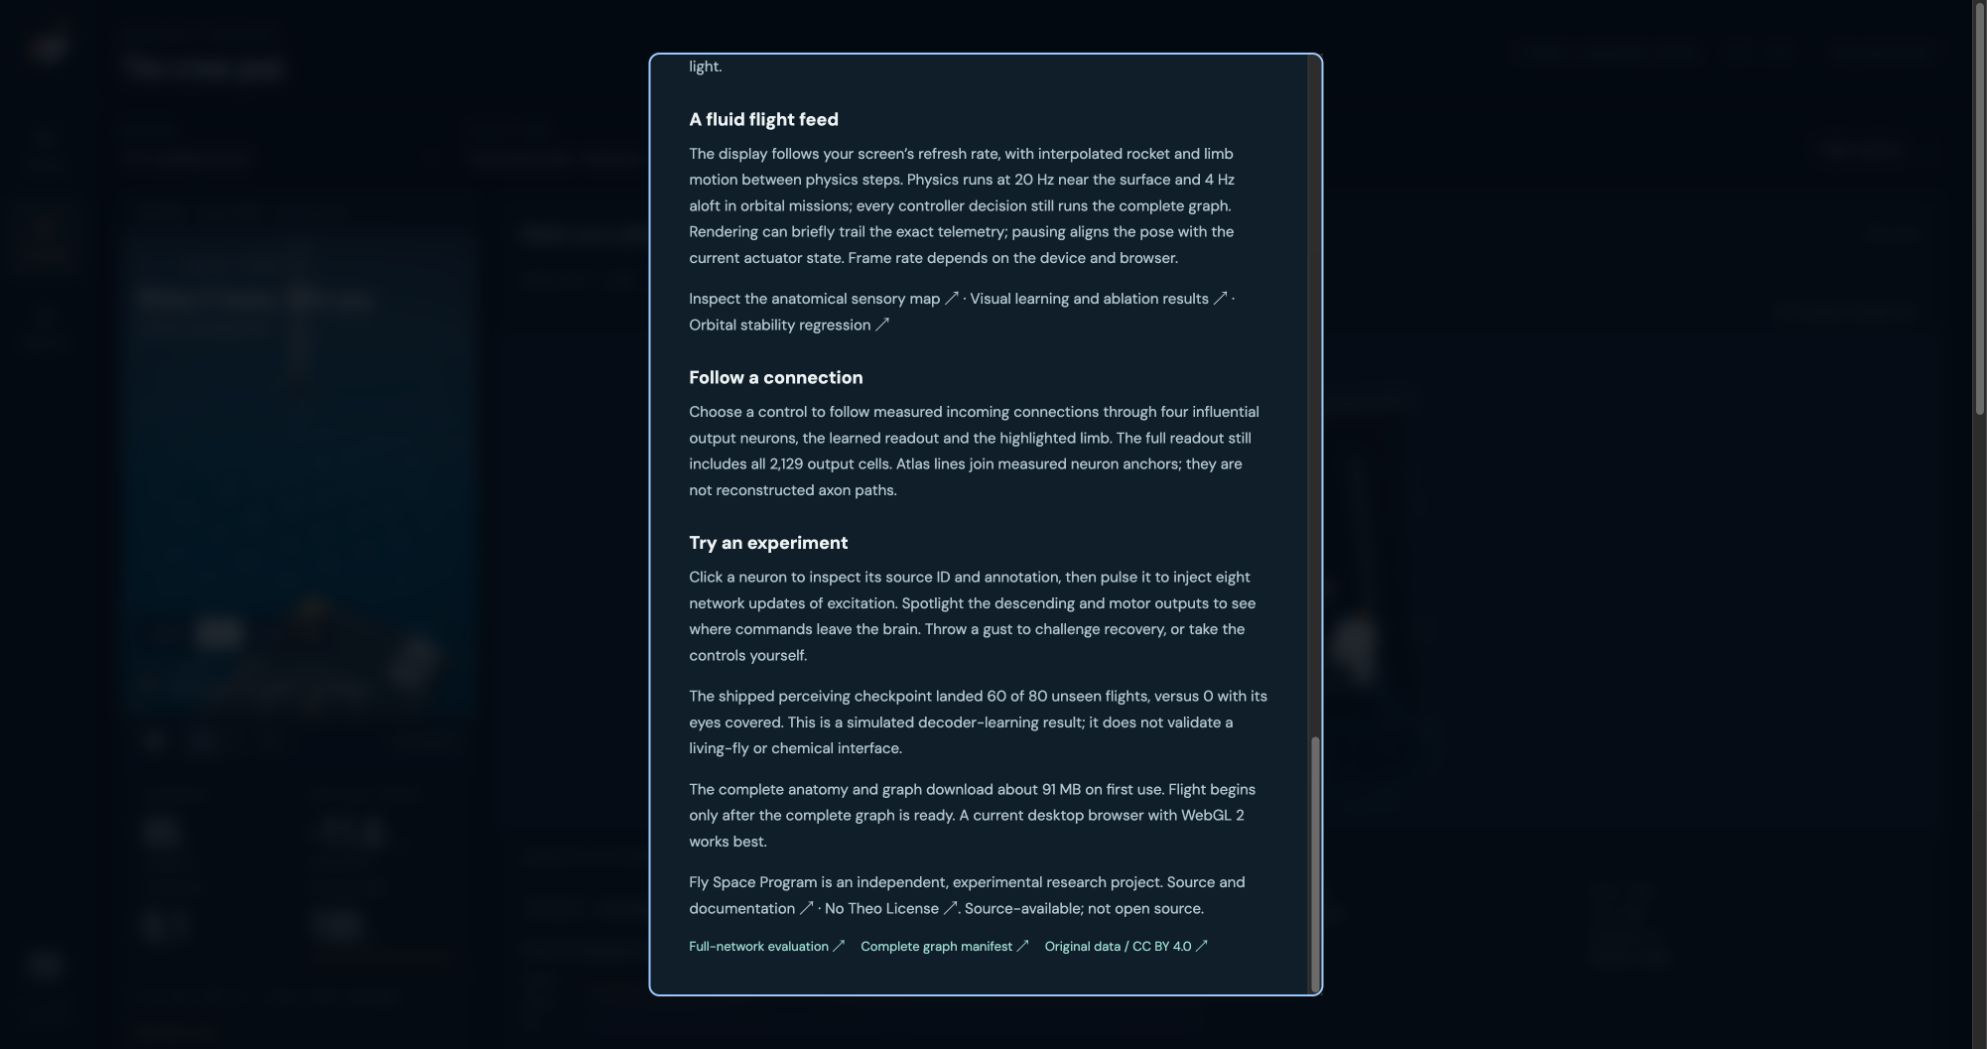
30The experiment: evidence and sources
The end of the dialog links evaluation data, the graph manifest, original data and source code. It states the source-available No Theo License and the limits of the shipped landing result.